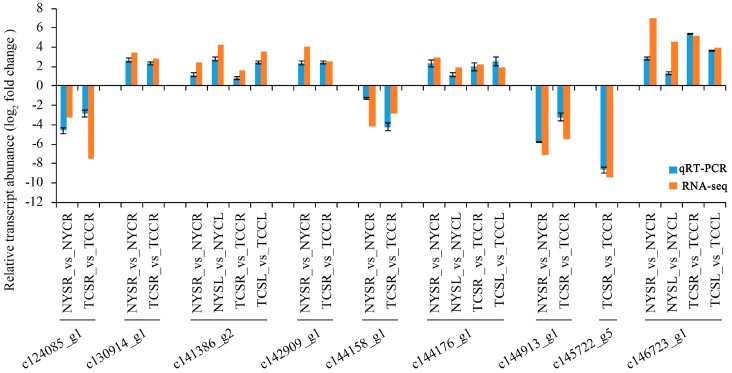
Figure 7.
Quantitative real-time PCR (qRT-PCR) validation analysis of RNA sequencing of nine DEGs. Data represent log2(fold changes) to each DEG’s relative transcript abundance in NYSR (NY salt-stressed root) vs. NYCR (NY control root); NYSL (NY salt-stressed leaf) vs. NYCL (NY control leaf); TCSR (TC salt-stressed root) vs. TCCR (TC control root); TCSL (TC salt-stressed leaf) vs. TCCL (TC control leaf). The blue bars represent the expression via qRT-PCR and red bars represent expression via RNA-seq.

