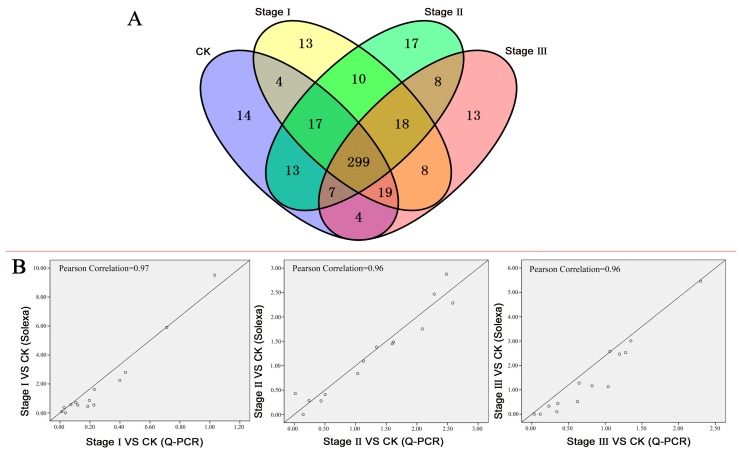
Figure 1.
Transcription factor identification and quantitative Polymerase Chain Reaction (qPCR) validation. (A) Venn diagram showing the numbers of TFs expressed in control check (CK), stage I, stage II and stage III. Each oval indicates the numbers of transcription factors (TFs) in CK or each treatment. (B) Correlations of the expression ratios of TFs between qPCR and deep sequencing. The x-axis and y-axis represent the expression ratios of the stage sample to CK by qPCR and deep sequencing. The Pearson correlations in stage I VS CK, stage II VS CK, and stage III VS CK are 0.97, 0.96 and 0.96, respectively.

