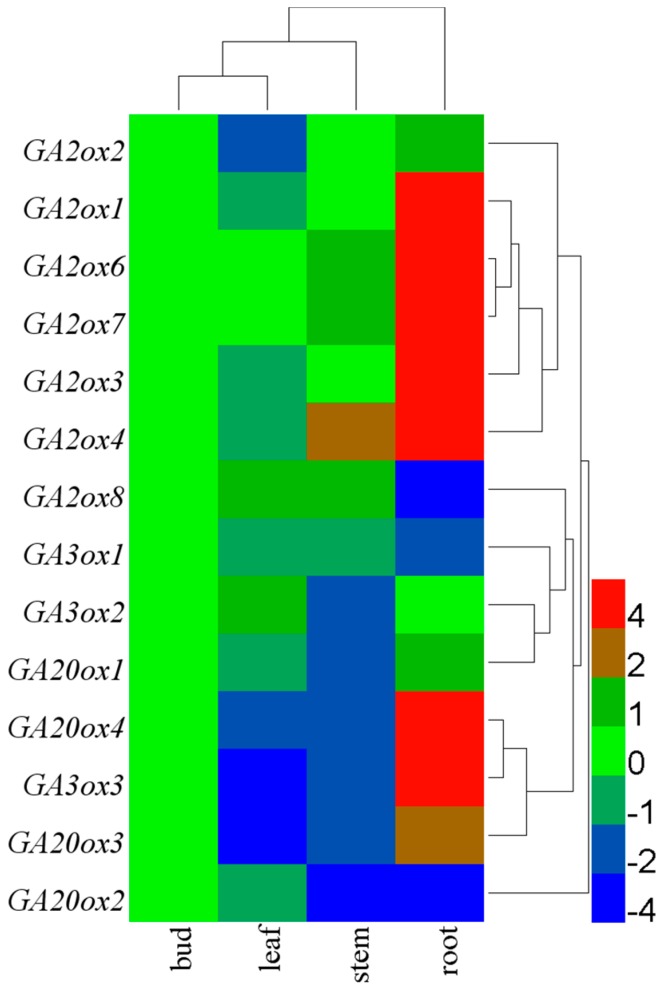
Figure 5.
Tissue-specific expression of CsGAoxs. The relative gene expression levels were calculated using the 2−ΔΔCt method and expressed as the fold change relative to expression of the bud tissue. Actin was used as housekeeping gene. The mean expression values were again normalized with logarithm with the base of 2 using the HemI [52] software. The color bar in all heat maps represents the expression values: blue represents low expression, green represents no significant difference in expression, and red denotes high expression.

