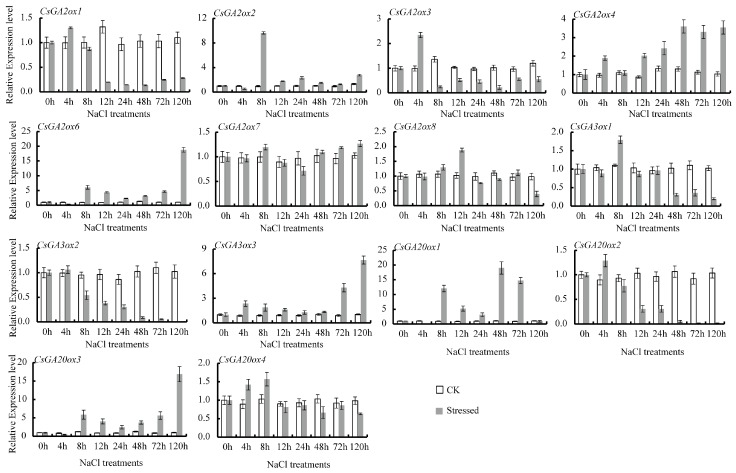
Figure 8.
Effect of high salinity stresses on CsGAox gene expression in leaves of tea plants. CK represents controls (non stress-treated plants) and stressed represents NaCl stress-treated plants. The relative gene expression levels were calculated using the 2−ΔΔCt method and expressed as the fold change relative to expression of the 0-h treatment. Actin was used as a housekeeping gene.

