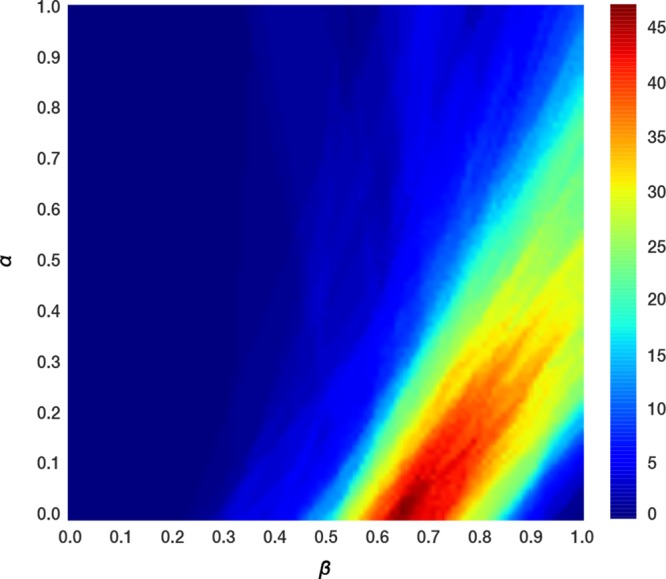
Figure 4.

LIE α and β model parameter scan performed on each of the 132 ligands individually by solving the iLIE equation (eq 3), for every point on a square grid of α and β model parameters between a value of 0 and 1 with a grid spacing of 0.01. The color gradient highlights the percentage of ligands having a ΔGpred value within 5 kJ mol–1 of ΔGobs for a given combination of α and β.
