
Figure 7.
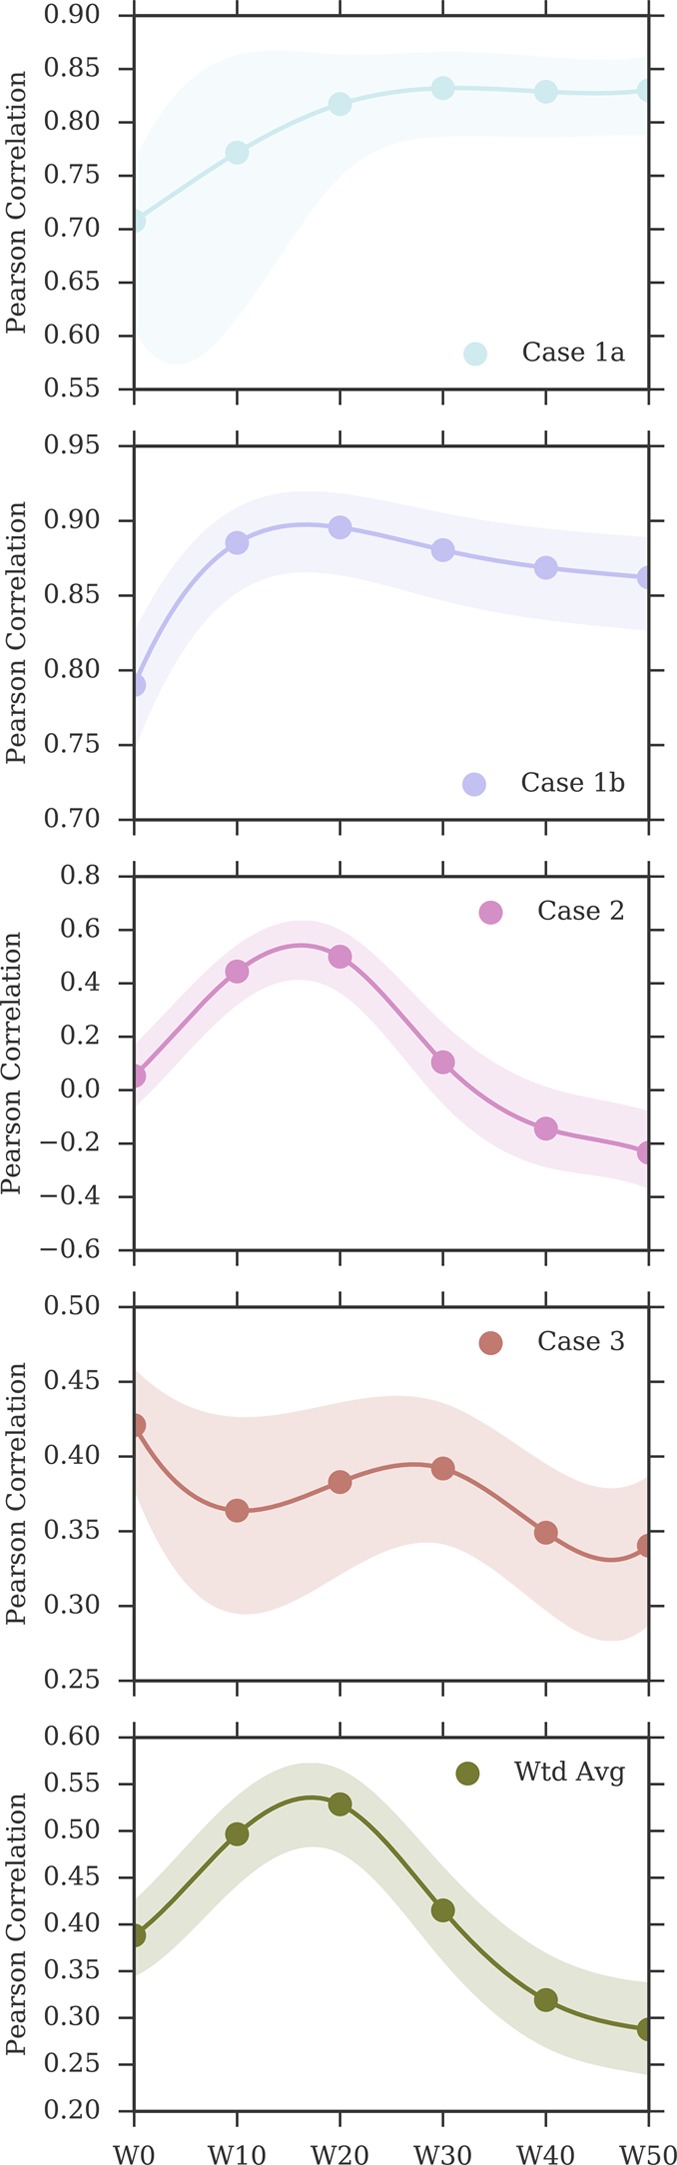
Change in Pearson correlation with the inclusion, in the MMPBSA calculations, of larger numbers of explicit water molecules representing the ligand hydration shell. The shaded area represents the 95% CI of the Pearson coefficient. The discrete data points (at W0, W10, W20, W30, W40, W50) have been interpolated with a cubic spline only for visualization purposes. Note the different scales on the y-axis.