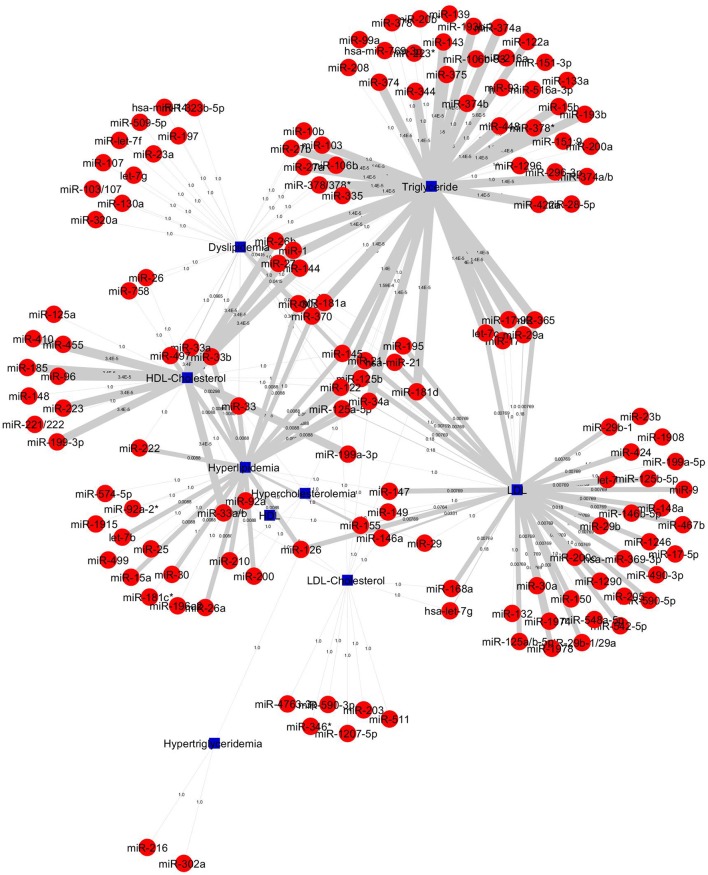
Figure 5.
All 227 miRNA-lipid disease associations by P-values. Red circles and green circles represent miRNAs and diseases, blue square represents lipid diseases/identifiers, respectively, according to the number of corresponding text mined annotated papers. Each linked pair represents a miRNA-disease association with edge-weighted measurement by P-values to visualize the strength of the miRNA-disease association. The miRNAs either connect one disease or more than one disease; it shows that a single miRNA or group of miRNAs may be involved with one or more than one disease.

