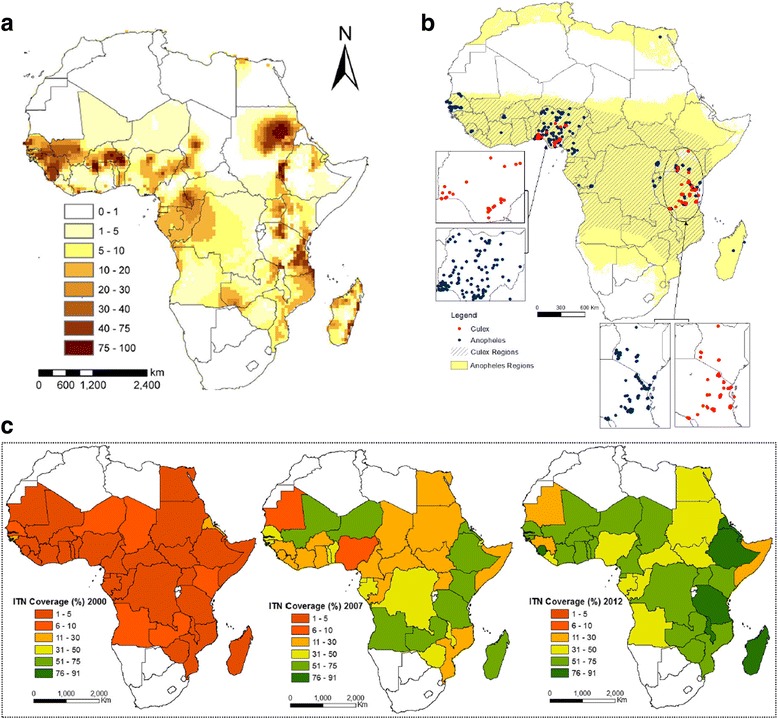
Fig. 1.

Mapped inputs for modeling the baseline transmission dynamics and effects of interventions against lymphatic filariasis (LF) in sub-Saharan Africa. a A smooth map of the estimates of LF prevalence is shown. The map was created using a multivariate Bayesian generalized linear spatial model, as described in [44]. b Smooth maps of the annual biting rates (ABRs) of Anopheles and Culex mosquitoes were created by simple kriging of ABR data obtained from literature searches and public databases (e.g., the Malaria Atlas Project (MAP)/Malaria Risk in Africa (MARA) databases). The observed data points are also shown. The Culex distribution is patchier than that of Anopheles, so we consider the Anopheles model to apply wherever Anopheles mosquitoes are implicated in transmission (Table 1). Only in those areas where Anopheles mosquitoes are not implicated at all did we use the Culex model. Note, however, that given the sparseness of the ABR data as shown on the map, we used model-estimated ABR values in the modeling exercise described in the text (see Methods). c Country-level coverages of bed nets (i.e., insecticide-treated nets (ITNs) interpolated from Admin1 data. Smoothed annual maps were developed for 2000–2012; here we show data for years 2000, 2007, and 2012
