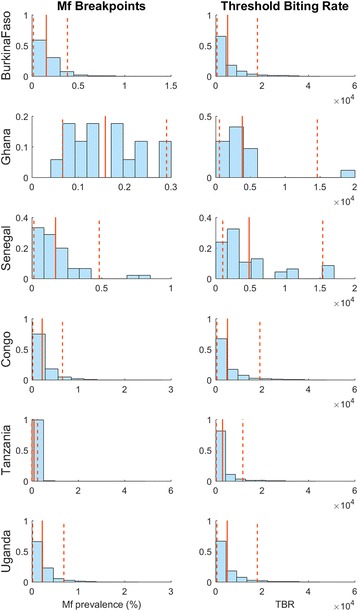
Fig. 4.

Histograms of breakpoints and threshold biting rates aggregated across modeled sites in a country. Solid vertical lines represent the mean value of the distribution, and dashed vertical lines represent the 5th and 95th percentile values, respectively. The histograms show that there is variation in transmission thresholds both within and between countries
