Fig. 3.

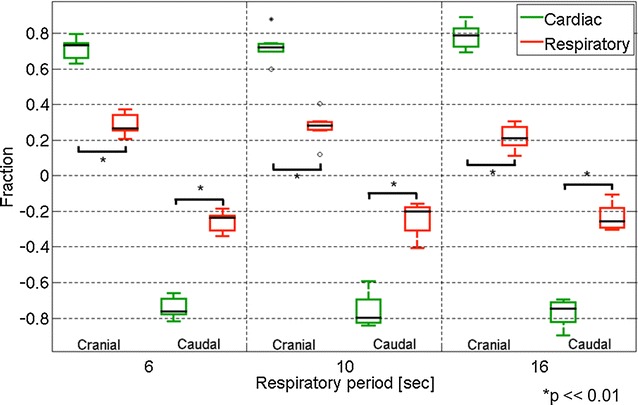
Similar box plots of the fractions of the CSF velocity components as Fig. 2 but at the foramen magnum. Outlying values are indicated by “o”, and far-outlying values are indicated by an asterisk

Similar box plots of the fractions of the CSF velocity components as Fig. 2 but at the foramen magnum. Outlying values are indicated by “o”, and far-outlying values are indicated by an asterisk