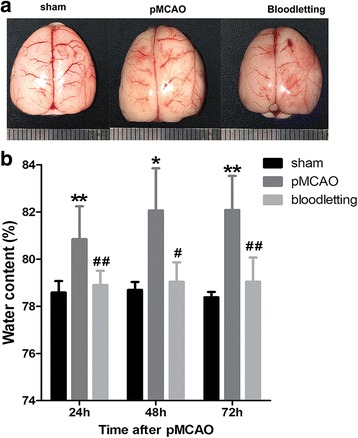
Fig. 2.

Effect of bloodletting puncture at HTWP on brain edema (n = 5 per group). a Representative images of brain edema in sham-operated group, pMCAO group, bloodletting group. b Quantitative analysis of brain swelling. *P < 0.05, **P < 0.01 vs. sham-operated goup; # P < 0.05, ## P < 0.01 vs. pMCAO group at the same time points
