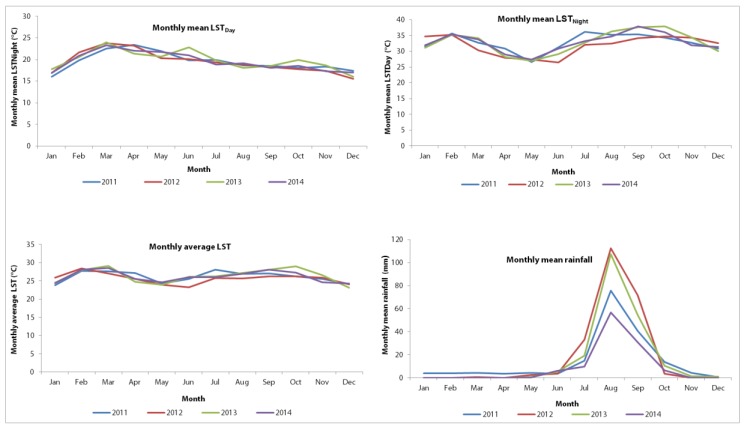
Figure 2.
Distribution of mean monthly climatic variables in Mbour, Senegal over a four-year period from January 2011 to December 2014. Upper row: Distribution of mean monthly land surface temperature (LSTDay) and Night (LSTNight), by month and year, over the period 2011–2014. Lower row: Distribution of monthly average land surface temperature and monthly mean cumulative rainfall, by month and year, over the period 2011–2014.

