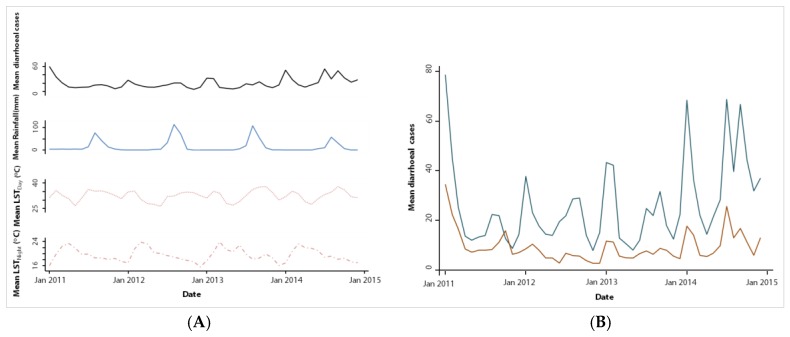
Figure 4.
Trend in mean monthly mean diarrhoeal cases per health facility and climatic factors in the health district of Mbour over a four-year period from 2011 to 2014. (A) Trend in monthly mean diarrhoeal cases per health facility with mean rainfall, mean LSTDay and LSTNight; (B) Trend in mean monthly diarrhoeal cases per health facility in urban and rural settings.

