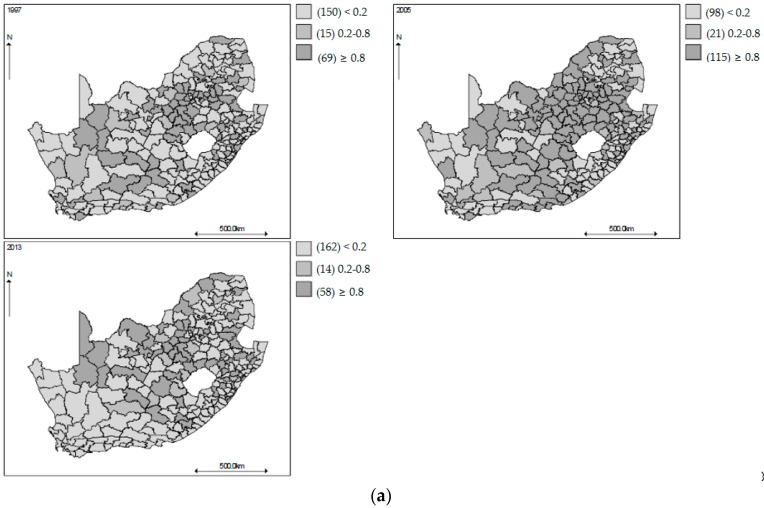
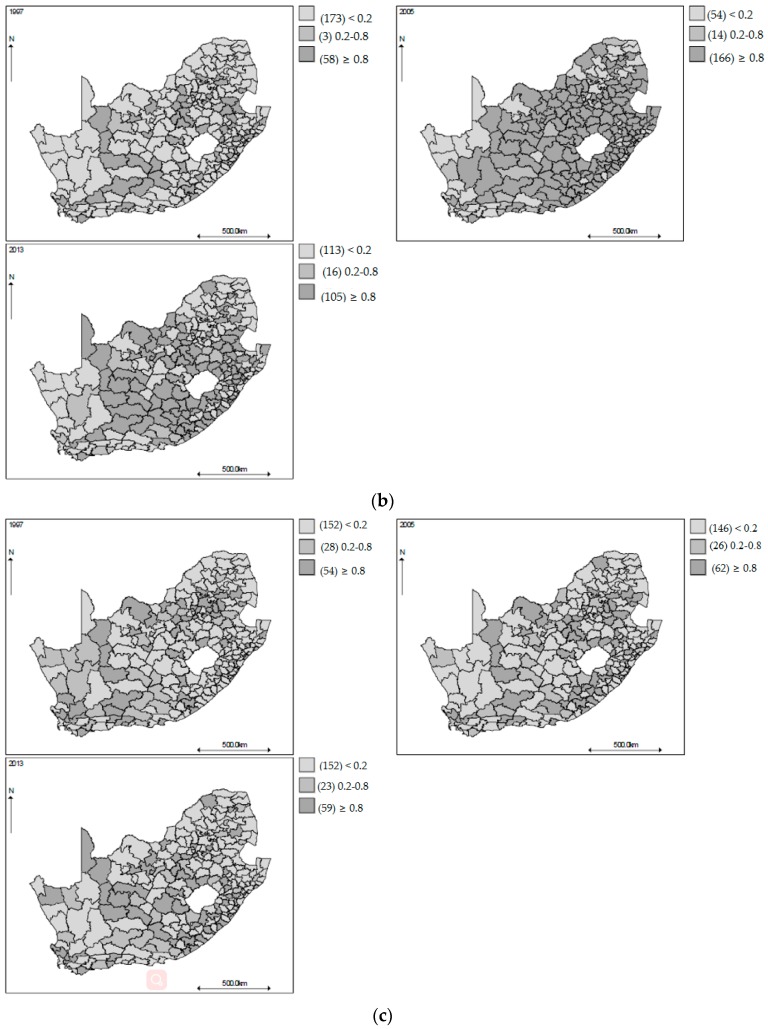
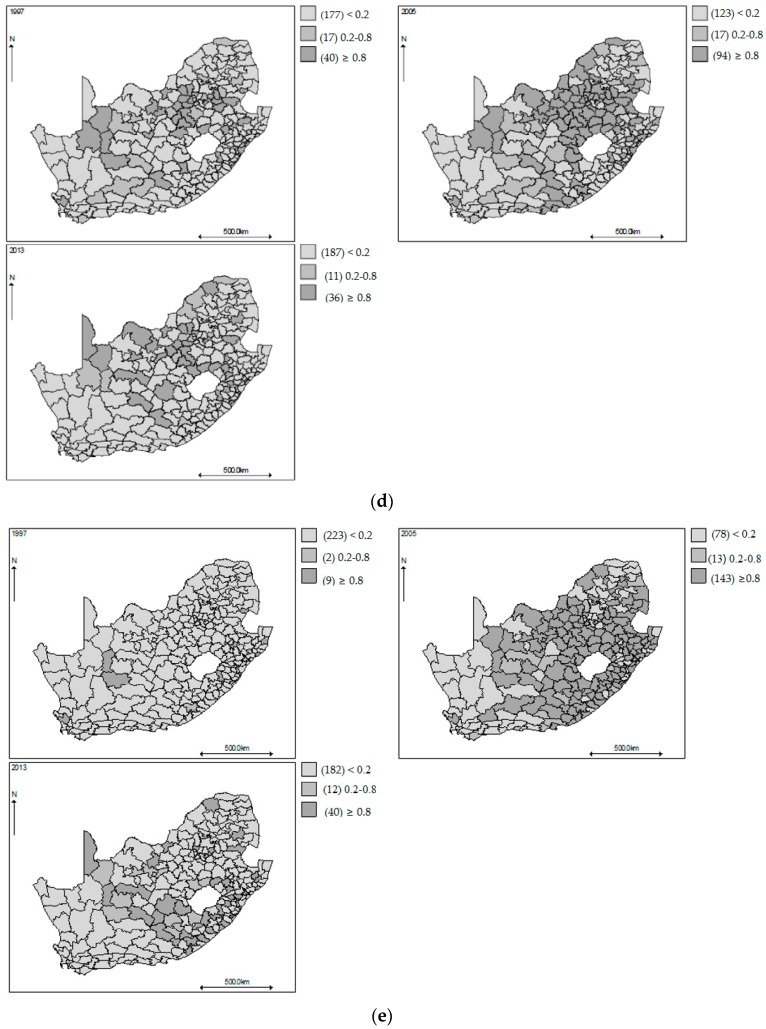
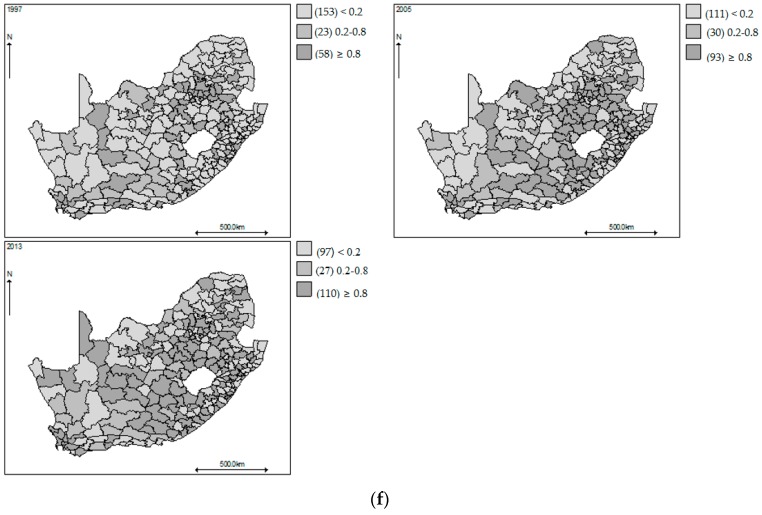
Figure 3.
(a) Mapped posterior probability that the all-cause smoothed standardized mortality ratios for males aged 0–14 years exceed 1 in 1997, 2005, and 2013, South Africa; (b) Mapped posterior probability that the all-cause smoothed standardized mortality ratios for males aged 15–64 years exceed 1 in 1997, 2005, and 2013, South Africa; (c) Mapped posterior probability that the all-cause smoothed standardized mortality ratios for males aged 65 years or over exceed 1 in 1997, 2005, and 2013, South Africa; (d) Mapped posterior probability that the all-cause smoothed standardized mortality ratios for females aged 0–14 years exceed 1 in 1997, 2005, and 2013, South Africa; (e) Mapped posterior probability that the all-cause smoothed standardized mortality ratios for females aged 15–64 years exceed 1 in 1997, 2005, and 2013, South Africa; (f) Mapped posterior probability that the all-cause smoothed standardized mortality ratios for females aged 65 years or over exceed 1 in 1997, 2005, and 2013, South Africa.


