Fig. 5.

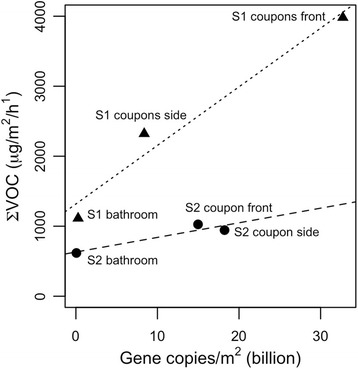
Sum of VOCs, as measured with the PTR-TOF-MS, and microbial gene copies (sum of bacteria and fungi), as estimated with qPCR. “S1” corresponds to sampling period 1 and “S2” to sampling period 2

Sum of VOCs, as measured with the PTR-TOF-MS, and microbial gene copies (sum of bacteria and fungi), as estimated with qPCR. “S1” corresponds to sampling period 1 and “S2” to sampling period 2