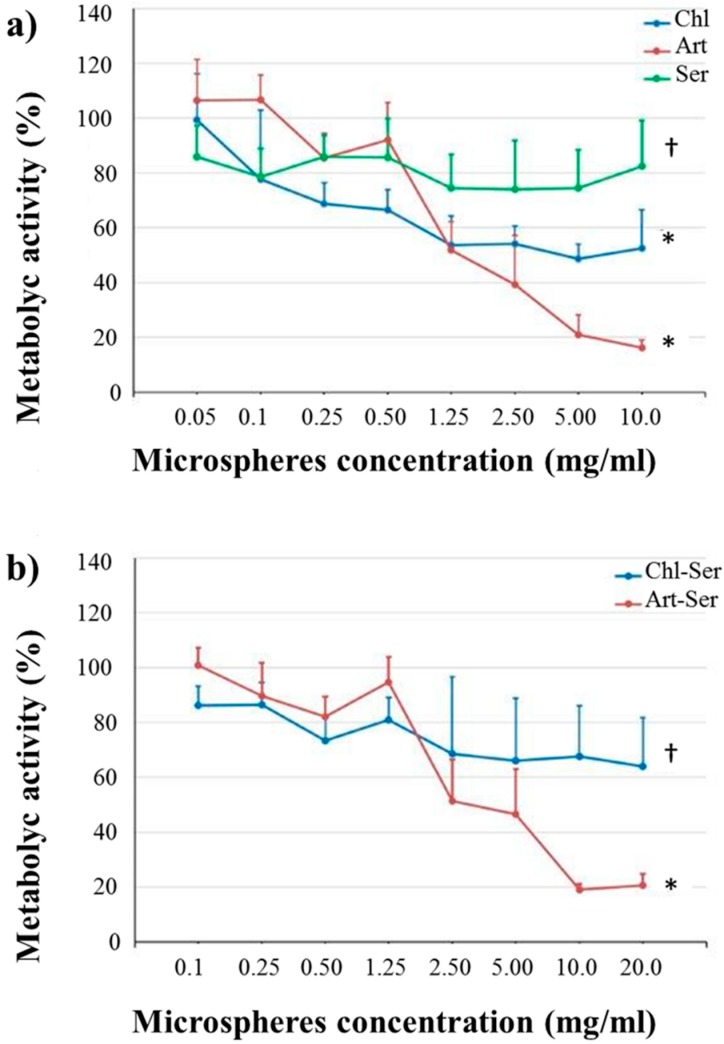
Figure 4.
Mean values of cell metabolic activity (%) and standard deviations, considering (a) Chl (blue line), Art (red line) and Ser (green line) formulations and (b) Chl-Ser (blue line) and Art-Ser (red line) formulations. For each graph, different symbols († and *) indicate significant differences between formulations (p < 0.05).

