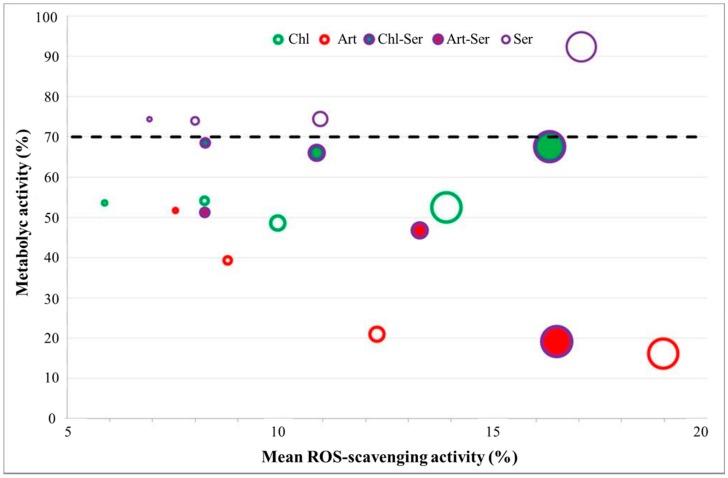
Figure 5.
Mean ROS-scavenging activity (%) and cell metabolic activity % for the all tested formulations. The diameter of the circles in the plot is proportional to the microsphere concentration: the larger circles correspond to the 10 mg/mL, the intermediate and intermediate-small circles are those of the 5 and 2.5 mg/mL, while the smaller circles represent the properties of the 1.25 mg/mL concentration of microspheres.

