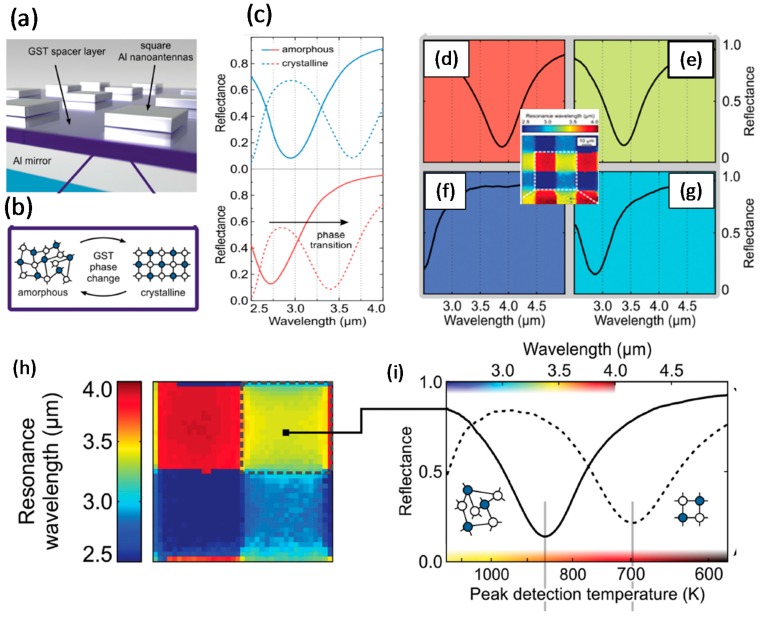
Figure 7.
GST-based perfect absorber with image capability. (a) Illustration of a switchable absorber; GST is packed between Al nanopatterns and Al mirror; (b) Sketch of GST phase change between two amorphous and crystalline phases; (c) Reflectance curve in MIR spectral region corresponding to the GST layer in both amorphous and crystalline phases; the higher resonance wavelengths are produced by the larger dimension of antennas; (d–g) Typical reflectance spectra of the four specific pixels illustrated in the inset, showing the imaging capability of the perfect absorber; (h) The resonance wavelength of four separate MIR absorption ranges; (i) Typical reflectance spectra of the yellow color-coded resonance wavelength for GST in both of the amorphous and crystalline phases. Peak detection temperature for the (j) amorphous and (k) crystalline phass of the GST layer. Adapted from [64], with permission from © 2015 John Wiley and Sons.


