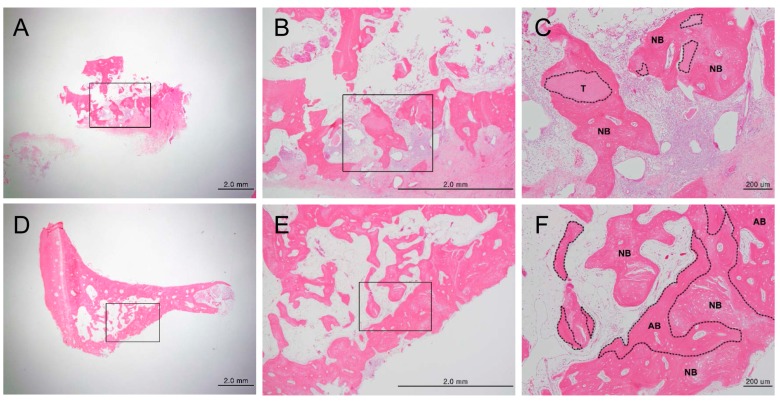
Figure 4.
Histological analysis of new bone formation at the bone defect area after eight weeks, by hematoxylin/eosin staining (magnification: (A,D) 12.5×; (B,E) 40×; (C,F) 100×). (A–C) Experimental group (DDM fixed with rhBMP-2); (D–F) Control group (autogenous bone graft). Figures (B) and (E) are higher magnification views of figures (A) and (D), respectively. Figures (C) and (F) are higher magnification views of figures (B) and (E), respectively. (C) The area enclosed within the dotted line represents DDM fixed with rhBMP-2, and newly-formed bone seen around the DDM. (F) The area within the dotted line indicates the autogenous bone graft, and newly-formed bone found around the autogenous bone graft. Scale bars: 2.0 mm (A,B,D,E), 200 μm (D,F). T: DDM fixed with rhBMP-2, NB: new bone, AB: autogenous bone.

