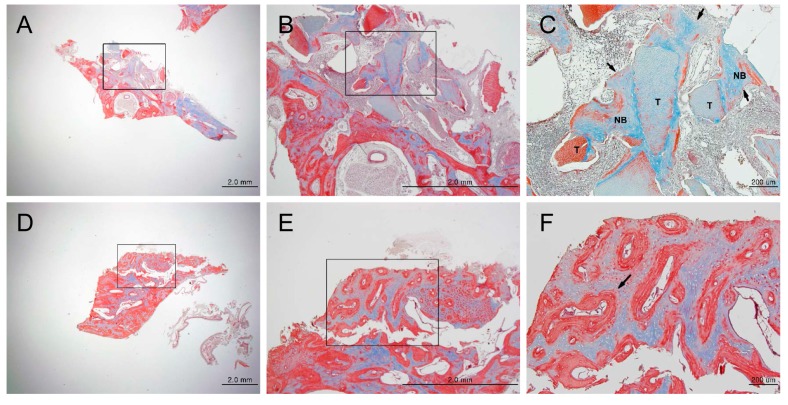
Figure 5.
Masson-trichrome staining in each group showing findings for new bone formation after eight weeks (magnification: (A,D) 12.5×; (B,E) 40×; (C,F) 100×). (A–C) Experimental group (DDM fixed with rhBMP-2); (D–F) Control group (autogenous bone graft). Figures (B) and (E) are higher magnification views of figures (A) and (D), respectively. Figures (C) and (F) are higher magnification views of figures (B) and (E), respectively. (C) General woven bone (blue color) formed around the TCP and mineralized bone (red color) was seen (arrow). (F) The amount of mineralized bone (red color) was greater in the autogenous bone graft group (arrow).

