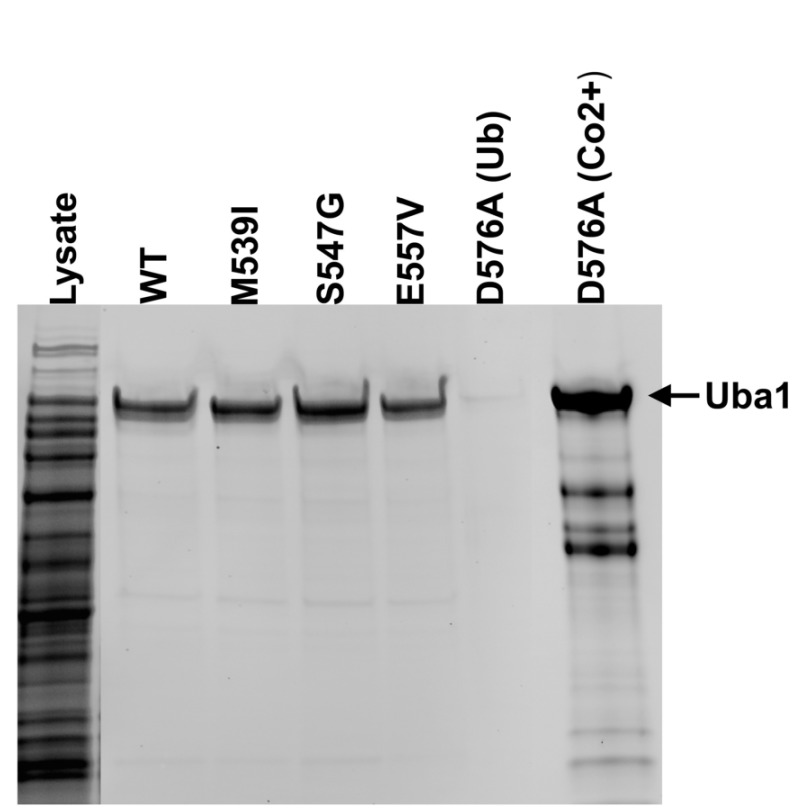
Figure 2. Expression and purification of Uba1.
SDS-PAGE image of the purification of Uba1. Bands at ~118kDa indicate full length, active WT, p.M539I, p.S547G, p.E557V, Uba1 as purified by a thiolester-linkage capture column. As predicted, the p.D576A did not bind to the Ub-agarose. The p.D576A was purified by Co 2+ affinity column as seen in the far right lane.

