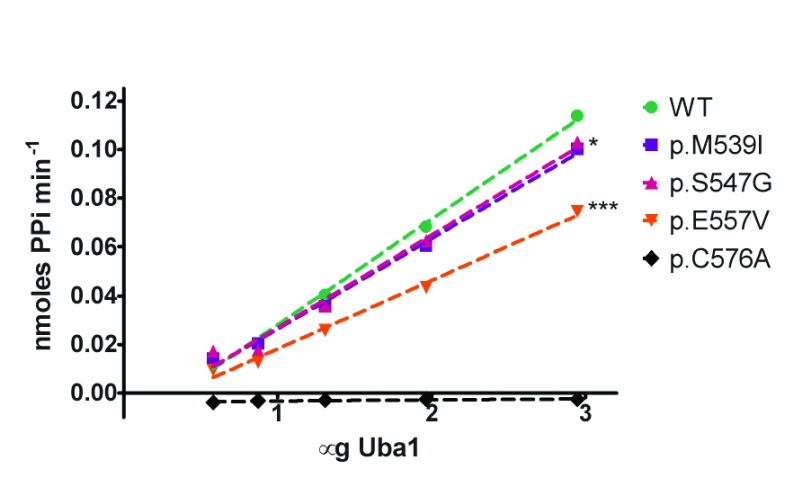
Figure 3. Uba1 adenylation activity plotted as a function of Uba1 enzyme amount.
Kinetic assays were run in triplicate under saturating conditions (Mg 2+ (10mM), ATP (2mM), Ub (100µM)) at 37°C. Wild-type (WT) and XL-SMA variants were assayed with a range of Uba1 amounts in 50mM HEPES buffer pH 8.0. Linear regression of WT slope compared to each variant shows statistical significance for p.M539I (*P = 0.028) and p.E557V (***P<0.0001).

