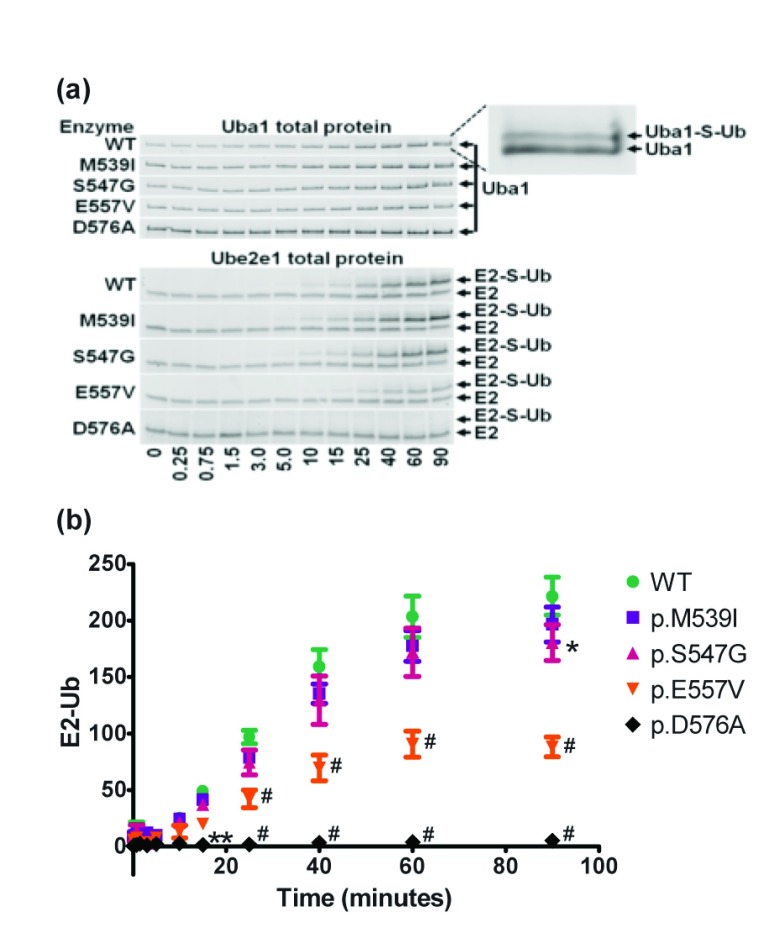
Figure 5. Uba1 transthioesteration of Ube2e1.
WT and mutant forms of Uba1 were incubated with Ub and Ube2e1 in the presence of ATP and Mg2+ for the indicated time. Reactions were quenched with Laemli buffer, separated by SDS-PAGE and quantitated with ImageJ software. A) Gel images are representative of total protein images from three independent experiments. Inset for visualization of Uba1-S-Ub complex gel shift. Note the lack of E2-S-Ub formation in the p.D576A mutant control. B) Quantitation of the E2-S-Ub gel shift bands. Y-axis values are integrated Ube2e1-Ub band densities (in millions) normalized to total Uba1 band densities. Error bars represent the SEM. Symbols indicate statistical significance (#P<0.0001, **P<0.01, *P<0.05) compared to WT using 2-way ANOVA.

