
Fig. 1.
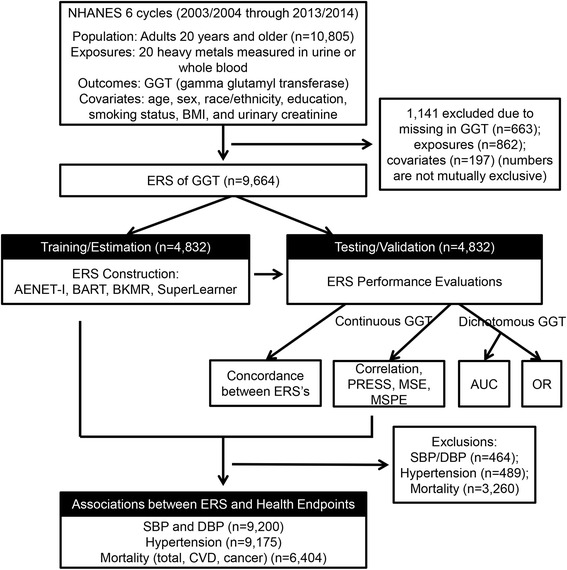
Schematic diagram of Environmental Risk Score (ERS) construction and analytical methods. AENET-I, adaptive elastic-net with main effects and pairwise interactions; BART, Bayesian additive regression tree; BKMR, Bayesian kernel machine regression; PRESS, predicted residual sums of squares; MSE, mean square error; MSPE, mean square prediction error; AUC, area under the receiver operating characteristics curve; OR, odds ratio; SBP/DBP, systolic and diastolic blood pressure; CVD, cardiovascular disease