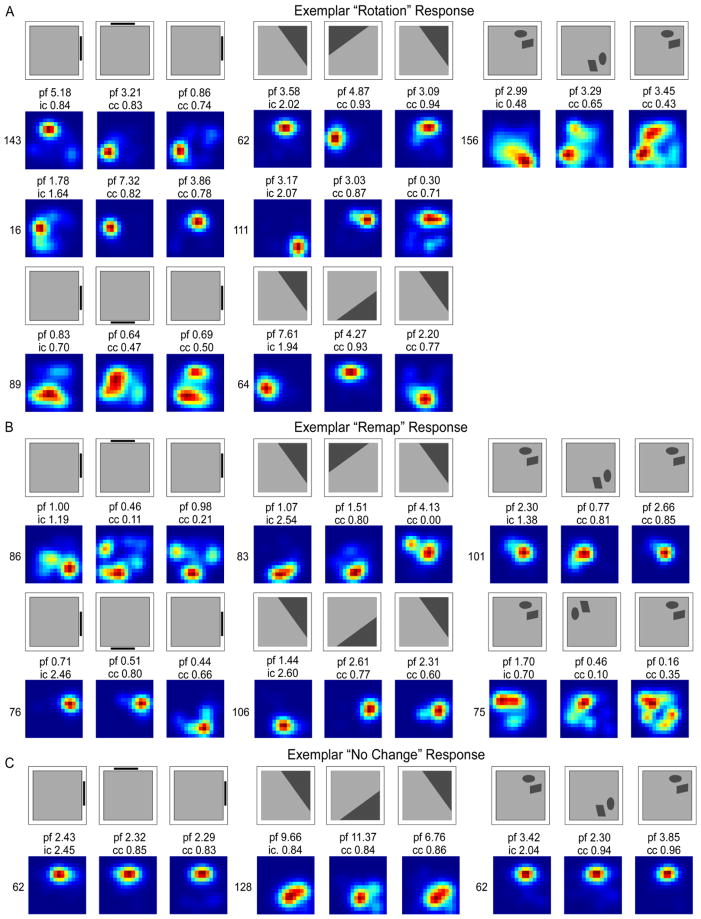
Figure 4.
Smoothed rate maps showing exemplar place field responses. Rotation (A), remap (B), and no change (C) responses are shown for the Landmark Wall (left), Landmark Floor (middle), and Object Floor (right) conditions. Above each rate map series is a schematic showing the direction of cue rotation. Abbreviations: peak firing field rate (pf), information content score for the first standard session (ic), the correlation coefficient (cc) for the rotation and second standard sessions.

