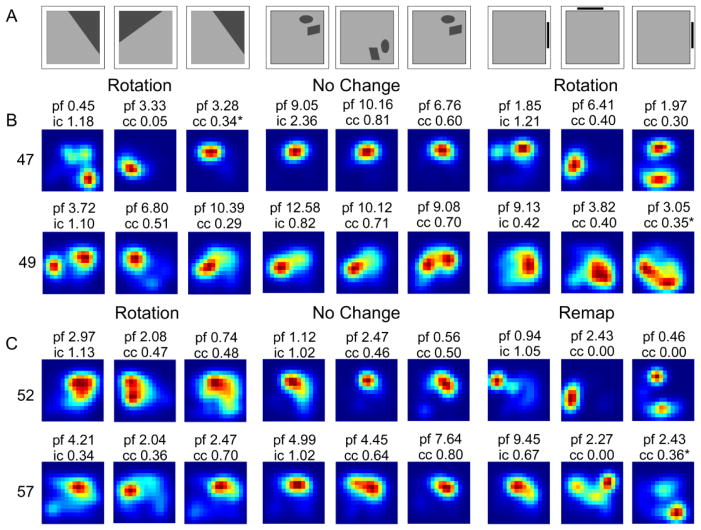
Figure 6.
Cells responded similarly across Landmark conditions and differently across Landmark and Object conditions. Shown are smoothed rate maps showing exemplar responses of cells recorded during early (D3–8) experience in all visual cue conditions. The peak firing field rate (pf), Information content score for the first standard session (ic) and the Correlation Coefficient (cc) for the rotated session and second standard are listed above each map. A. Schematic of condition order and rotation direction. B. Cell 47 and 49 rotated with cues in the Landmark conditions, but did not change in response to rotations of cues in the Object condition. C. Cells 52 and 57 rotated with cues in the Landmark Floor condition, remapped in the Landmark Wall condition, and did not change in response to rotations of cues in the Object Floor Condition.

