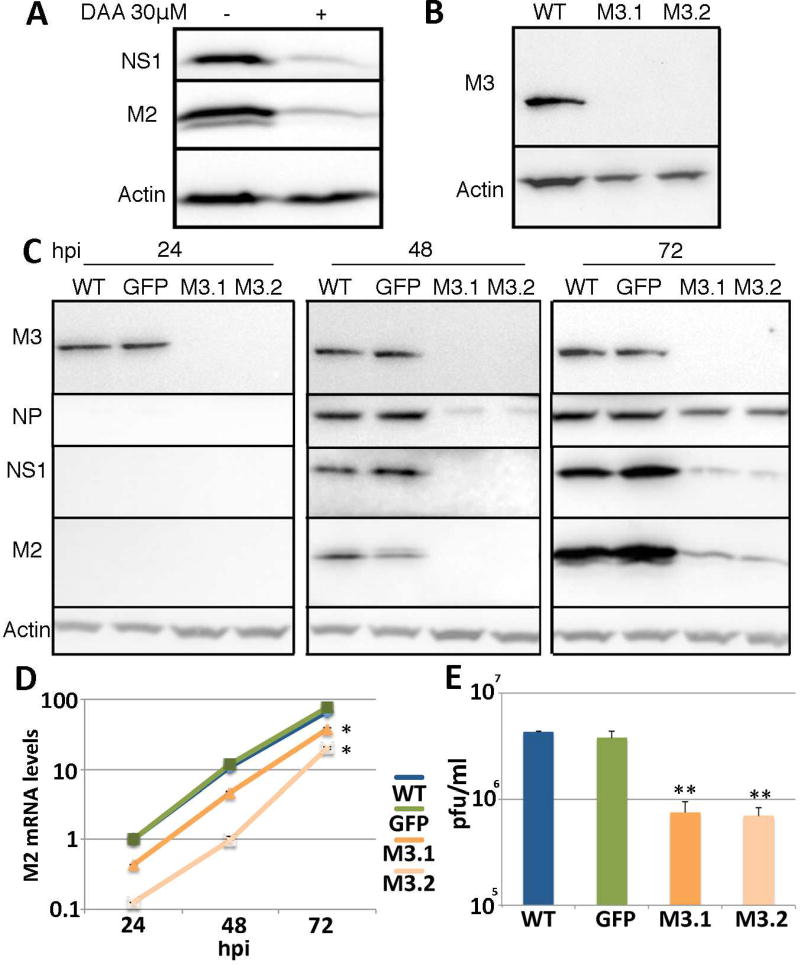
Figure 1. IAV gene expression is greatly reduced in METTL3 knockout cell lines.
(A) Treatment of cells with a non-toxic dose of DAA, an inhibitor of m6A addition, reduced expression of the IAV proteins NS1 and M2 in A549 cells, as determined by Western blot. A549 cells were infected at an MOI of 1.0. (B) Two clonal A549 METTL3 knockout cell lines, M3.1 and M3.2, were established using gene editing and confirmed by Western blot and genomic sequencing. See Fig. S1 for genomic sequences and Table S1 for sgRNA sequences. (C) Two A549 METTL3 knockout lines and two control cell lines, including the parental A549 cell line and a GFP-Flag expressing A549 cell line, were infected with IAV-PR8 at an MOI of 0.01 and NP, NS1 and M2 protein expression determined by Western blot at 24, 48 and 72 hours post infection (hpi). Quantification of the band intensities for NS1 and M2 at 72 hpi revealed expression levels of 0.12 ± 0.01 and 0.12 ± 0.07 for M3.1 and 0.09 ± 0.03 and 0.08 ± 0.03 for M3.2, respectively, when expression in wild type cells was normalized to 1.0. Actin was used as the loading control. (D) Quantitative RT-PCR (qRT-PCR) was performed to determine the levels of the spliced IAV M2 mRNA at the same time points post-infection. See Table S2 for primer sequences. (E) Viral production from the wild type and METTL3 KO cells at 72 hpi was quantified by plaque assay on MDCK cells These data represent the average of three biological replicates with SD indicated (*=p<0.05, **=p<0.01).

