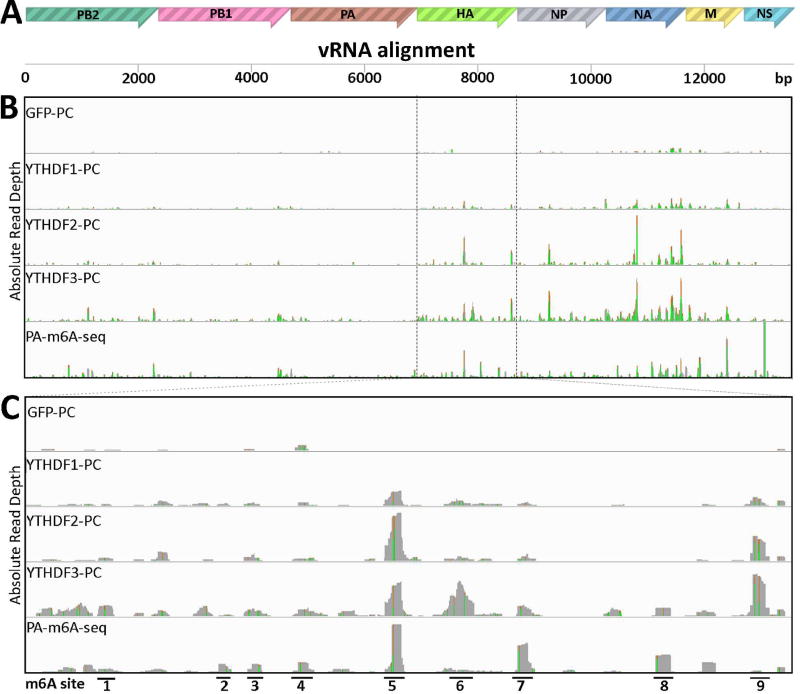
Figure 4. Identification of m6A sites on IAV-PR8 minus strand vRNA.
PAR-CLIP and PA-m6A-seq were performed on RNA from 293T cell lines 24 hpi with IAV-PR8 at MOI of 10. (A) Concatenated map of the IAV-PR8 genome used for read alignment. (B) Complete genomic coverage tracks are shown, similar to Fig. 2. The PA-m6A-seq lane has a Y axis of 0–2000 reads, and all others are depicted with Y axes of 0–300 reads. (C) An expanded view of the HA segment of IAV-PR8, with 9 prominent m6A sites numbered. PA-m6A-seq has a Y axis of 0–1000 reads, and all others are depicted with Y axes of 0–150 reads. Green/brown bars indicate the level of A>G conversion at specific A residues.

