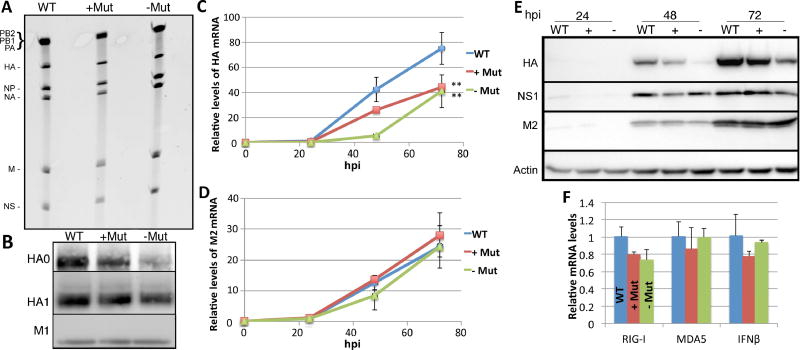
Figure 5. Mutagenesis of m6A motifs on the IAV HA segment inhibits HA mRNA and protein expression.
Mutations introduced into the HA segment are described in Fig. S3. (A) Viral RNA extracted from purified IAV-PR8 virions grown in embryonated chicken eggs was separated on a TBE-urea gel and stained. (B) Protein was extracted from purified IAV and Western blotting used to determine HA protein levels in wild type or mutant virions. Band intensity quantification revealed HA0 and HA1 levels of 0.8 ± 0.63 and 0.8 ± 0.54 for the +Mut virions and 0.5 ± 0.53 and 0.6 ± 0.48 for the −Mut virions, respectively, when HA levels in wild type virions was normalized to 1.0. The viral protein M1 was used as a loading control. (C) A multicycle spreading infection was initiated by infection of A549 at an MOI of 0.01 using all 3 IAV-PR8 variants. Total RNA was extracted at 24, 48 and 72 hpi and qRT-PCR then used to determine HA mRNA levels, relative to a GAPDH mRNA internal control. See Table S2 for primer sequences. (D) The same total RNA samples used in panel C were used to quantify M2 mRNA levels, again using GAPDH mRNA as an internal control. (E) Similar to panel C except that Western blotting was performed to evaluate the level of expression of the IAV HA, NS1 and M2 proteins at 24, 48 and 72 hpi. Quantification of HA band intensity at 72 hpi revealed expression levels of 0.69 ± 0.11 for the +Mut virus and 0.32 ± 0.13 for the −Mut virus, when normalized to M2 expression levels. Actin was used as the loading control. Viral spread was also determined by flow cytometry (see Fig. S4). (F) A549 cells were infected at an MOI of 1.0 with the three IAV-PR8 variants and total RNA extracted 12 hpi. qRT-PCR was used to determine the levels of the cellular mRNAs encoding RIG-I, MDA5 and IFNβ1. All data are drawn from three biological replicates with SD indicated (**=p<0.01).

