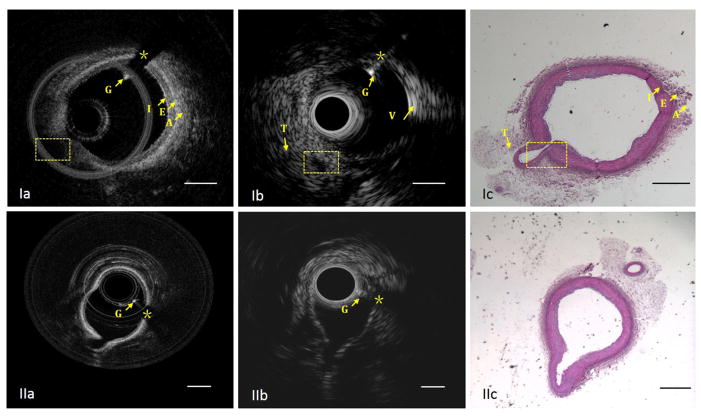
Fig. 6.
An IVUS-OCT image pair obtained in a normal swine coronary artery in vivo during the injection of iohexol. (Ia) OCT image (Ib) IVUS image (Ic) corresponding H&E histology. Another IVUS-OCT image pair, also obtained in swine, demonstrates LAD branching. (IIa) OCT (IIb) IVUS cross-sectional image. (IIc) Corresponding H&E histology. * denotes guidewire artifact. G: guide wire. T: tissue. V: vessel. I: intima. E: EEL. A: adventitia. Yellow boxes denote LAD branch. Scale bar: 1mm. Row I is a reprint from [24], with permission.

