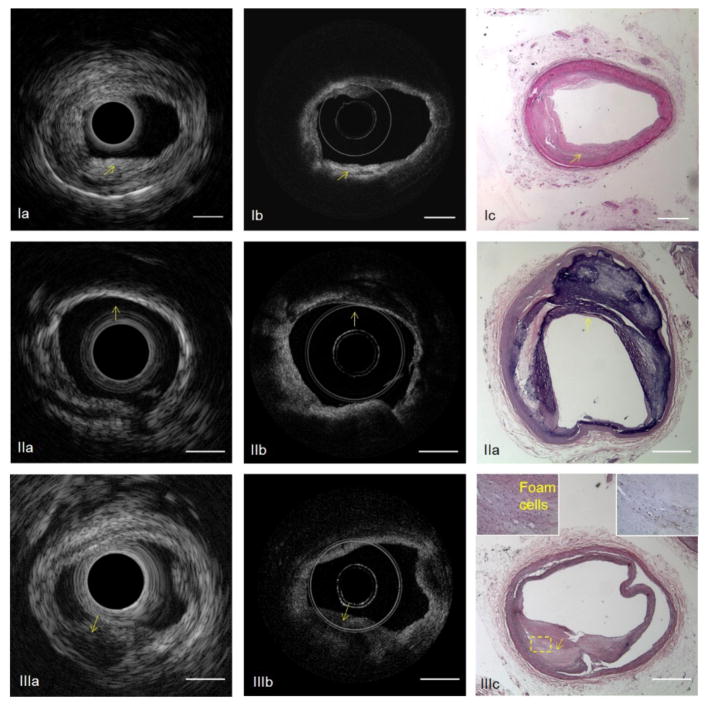
Fig. 7.
Imaging of a coronary artery with a fibrous plaque (top row), a calcified plaque (middle row) and lipid plaque (bottom row). (Ia)(IIa)(IIIa) IVUS, (Ib)(IIb)(IIIb) OCT images, and (Ic)(IIc)(IIIc) corresponding histology image. Insets in (IIIc), high magnified images of the histology slides. Left inset, stained with H&E; right inset, stained with CD68. Arrows denote the location of plaques. Scale bar: 1mm. Reprinted from [24], with permission.

