Figure 4.

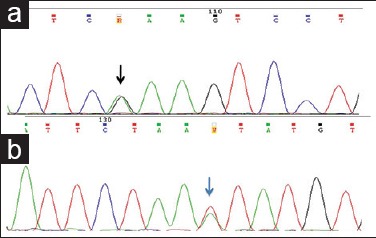
Partial electropherograms with exon13 and 17 mutations (a) heterozygous mutation involving exon 13 (c.1924A>G) (black arrow). (b) Heterozygous mutation involving exon 17 (c.2466T>A) (blue arrow)

Partial electropherograms with exon13 and 17 mutations (a) heterozygous mutation involving exon 13 (c.1924A>G) (black arrow). (b) Heterozygous mutation involving exon 17 (c.2466T>A) (blue arrow)