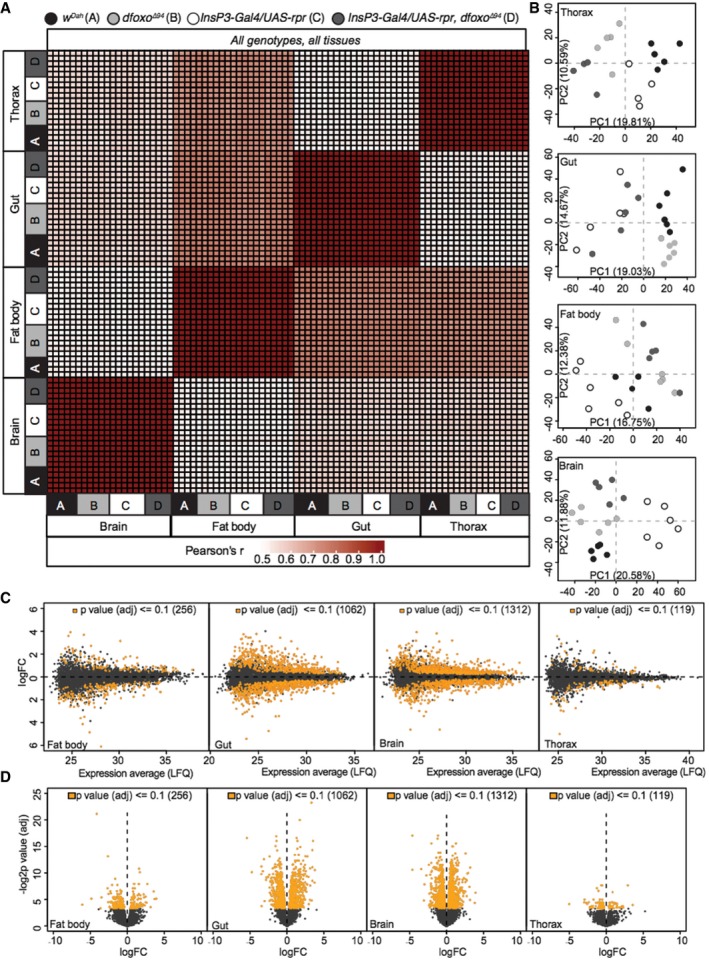
Figure EV1. Tissue‐specific proteomic analysis in Drosophila .

- Correlation heatmap (Pearson's correlation coefficient) across all tissues (thorax, gut, fat body and brain) and all genotypes (A: w Dah , B: dfoxo Δ94 , C: InsP3‐Gal4/UAS‐rpr and D: InsP3‐Gal4/UAS‐rpr, dfoxo Δ94).
- Tissue‐specific PCA plots showing inter‐genotype clustering of individual samples.
- Tissue‐specific MA plots of log2 fold change and average expression level (LFQ) for all detected (black) and significantly regulated (orange) proteins between InsP3‐Gal4/UAS‐rpr vs. w Dah flies (FDR = 0.1).
- Tissue‐specific volcano plots of −log2 P‐value (adjusted) and log2FC for all detected (black) and significantly regulated (orange) proteins between InsP3‐Gal4/UAS‐rpr vs. w Dah flies (FDR = 0.1).
