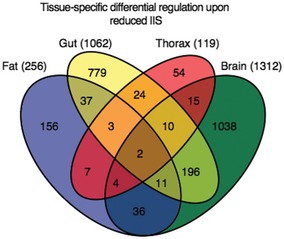
Figure 2. Proteome response to reduced IIS is highly tissue‐specific.

Venn diagram of differentially expressed proteins upon reduced IIS, comparing tissues from control (w Dah) and mNSC‐ablated flies. Total number of differentially expressed, tissue‐specific proteins is shown in parentheses.
