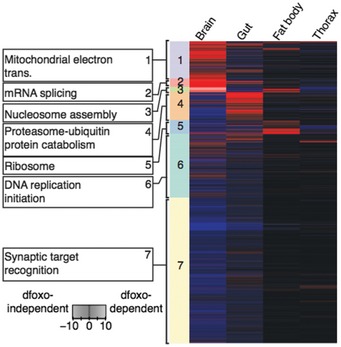
Figure 3. Hierarchical clustering and GO enrichment analysis of dFOXO‐dependent and dFOXO‐independent IIS‐mediated regulation of the proteome.

Tissue‐specific heatmap of significantly regulated dfoxo‐dependent (red) and dfoxo‐independent (blue) proteins in response to reduced IIS. Coloured side bars represent network propagated score clustering and associated most significantly enriched GO terms.
