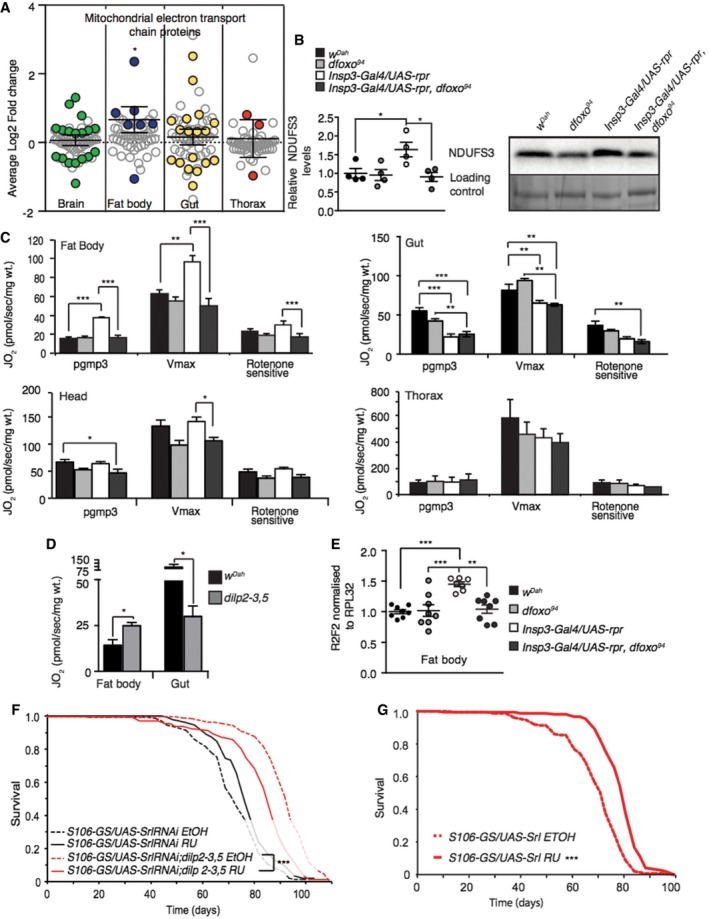
Figure 4. Reduced IIS differentially regulates tissue‐specific mitochondrial function and biogenesis.

- Average log2 fold change of IIS‐regulated proteins associated with the functional term mitochondrial electron transport chain. One‐sample t‐test shows directional significance. Grey circles show all detected proteins, and coloured circles show significantly regulated proteins.
- Western blot analysis of fat body NDUFS3, and stain free loading control (n = 4), significance determined by t‐test.
- Fat body, gut, head and thorax oxygen consumption normalized to dry wt. in 10 days old control, dfoxo Δ94 mutants, mNSC ablation, mNSC‐ablated flies lacking dfoxo. Oxygen consumption was assessed by using substrates entering the level of complex I (PGMP3), complex I+II once uncoupled by CCP (Vmax) and rotenone‐sensitive complex I+II + rotenone (n = 5).
- Respiratory measurements of an independent IIS mutant (dilp2‐3,5) compared to controls (w Dah) (n = 5), significance determined by t‐test.
- Relative mtDNA levels compared to nuclear DNA in fat body (n = 8). Relative mtDNA levels in the gut, head and thorax are shown in Fig EV4A. Significance determined by one‐way ANOVA.
- Lifespan analysis of dilp2‐3,5 mutant and control flies with reduced expression of Spargel in the fat body (S106‐GS/UAS‐SrlRNAi) induced by RU or none induced (n = 150/genotype/treatment). Lifespan analysis of genetic controls shown in Fig EV4D. Statistical significance was determined by Log Rank test.
- Lifespan analysis of flies over‐expressing Spargel, in the adult fat body (n = 150/genotype/treatment). Genetic control lifespan shown in Fig EV4G. Statistical significance was determined by Log Rank test.
