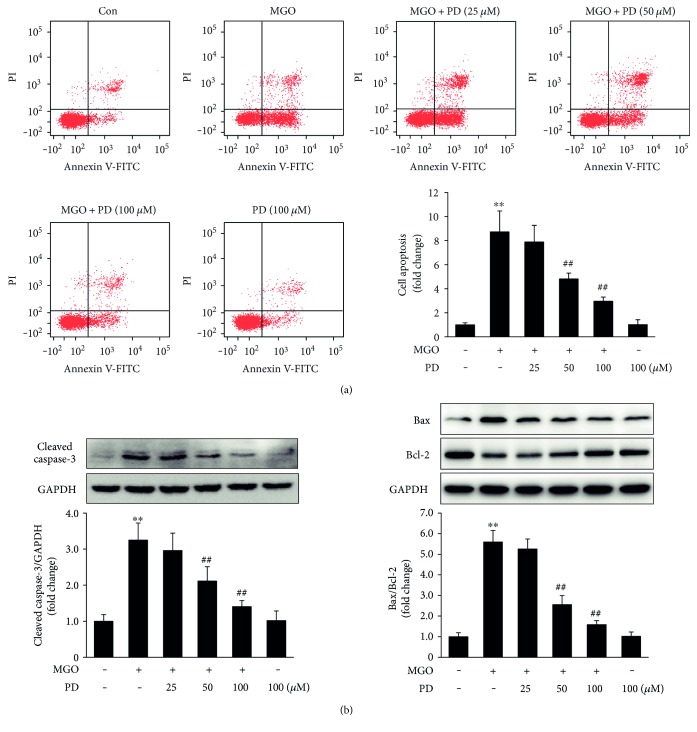
Figure 2.
PD prevents MGO-induced HUVEC apoptosis. HUVECs were pretreated with PD for 2 h, followed by stimulation with MGO (200 μM) for 24 h. (a) Cells were trypsinized and stained with Annexin V-FITC and PI for 15 min. Then apoptosis was analyzed by flow cytometry. Representative images of cell population distribution are shown, and quantitative assessment of 3 independent cell apoptosis experiments was performed. Data shown are mean ± SD and are expressed as fold changes. ∗∗P < 0.01 versus Con; ##P < 0.01 versus MGO. (b) Expression of cleaved caspase-3, Bax, and Bcl-2 was analyzed by Western blotting. Representative images of 3 independent experiments and densitometric analysis of the levels of cleaved caspase-3 normalized to GAPDH and Bax normalized to Bcl-2 are shown. Data shown are mean ± SD and are presented as fold changes. ∗∗P < 0.01 versus Con; ##P < 0.01 versus MGO.

