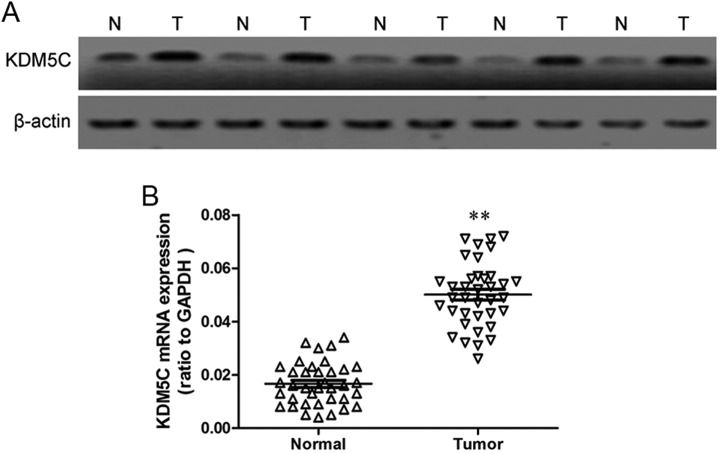
Figure 1.
Expression of KDM5C in gastric cancer tissues. A, KDM5C protein levels in tumor tissues and matched normal tissue lesions, as assessed using Western blotting analyses. β-Actin was used as a loading control. B, KDM5C mRNA levels in tumor tissues and matched normal tissue lesions, as assessed using qRT-PCR analyses. The data represent the means ± SD of 3 independent experiments. **P < .01. qRT-PCR indicates quantitative reverse transcription polymerase chain reaction; mRNA, messenger RNA; SD, standard deviation.

