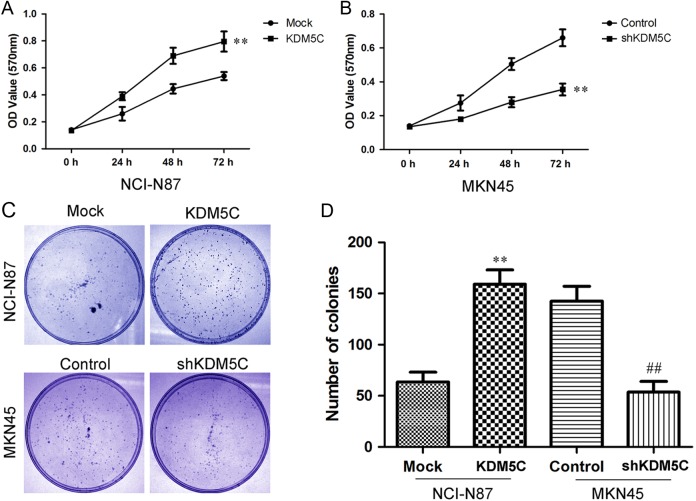
Figure 3.
Effects of KDM5C on proliferation in gastric cancer cell lines. A, Cell proliferation after KDM5C overexpression in NCI-N87 cells was measured using MTT assays. B, Cell proliferation after KDM5C knockdown in MKN45 cells was measured using MTT assays. C, The results of colony formation assays that were conducted in KDM5C-transfected gastric cancer cell lines. D, The summary graphs are presented for the colony formation assay that was outlined in C. The data represent the means ± SD of 3 independent experiments. **P < .01 versus Mock group; ## P < .01 versus control group. MTT indicates 3-(4,5-dimethylthiazol-2-yl)-2,5-diphenyl tetrazolium; SD, standard deviation.

