Figure 6.
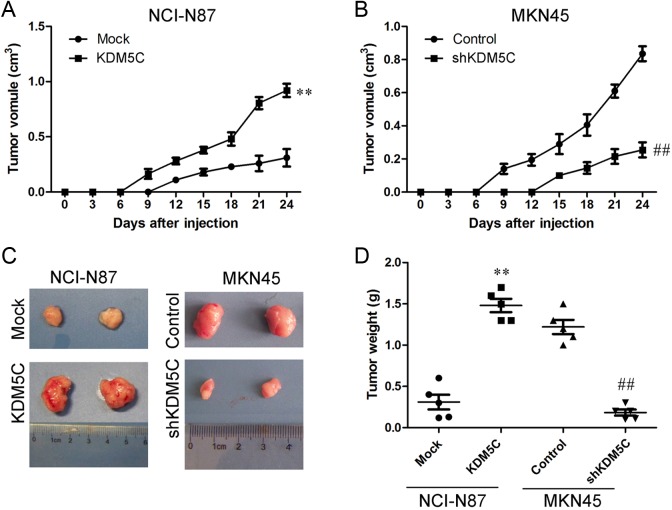
KDM5C inhibited tumorigenesis in vivo. A, Growth curves of mammary tumors after the injection of KDM5C-overexpressing NCI-N87 and control cells into SCID mice. The error bars represent the means ± SD (n = 5). B, Growth curves of mammary tumors after the injection of KDM5C-silenced MKN45 and control cells into SCID mice. The error bars represent the means ± SD (n = 5). C, Representative tumors are presented from the experiments that were outlined in A and B. D, Weight of tumors was measured. **P < .01 versus Mock group; ## P < 0.01 versus control group. SCID indicates severe combined immunodeficient; SD, standard deviation.

