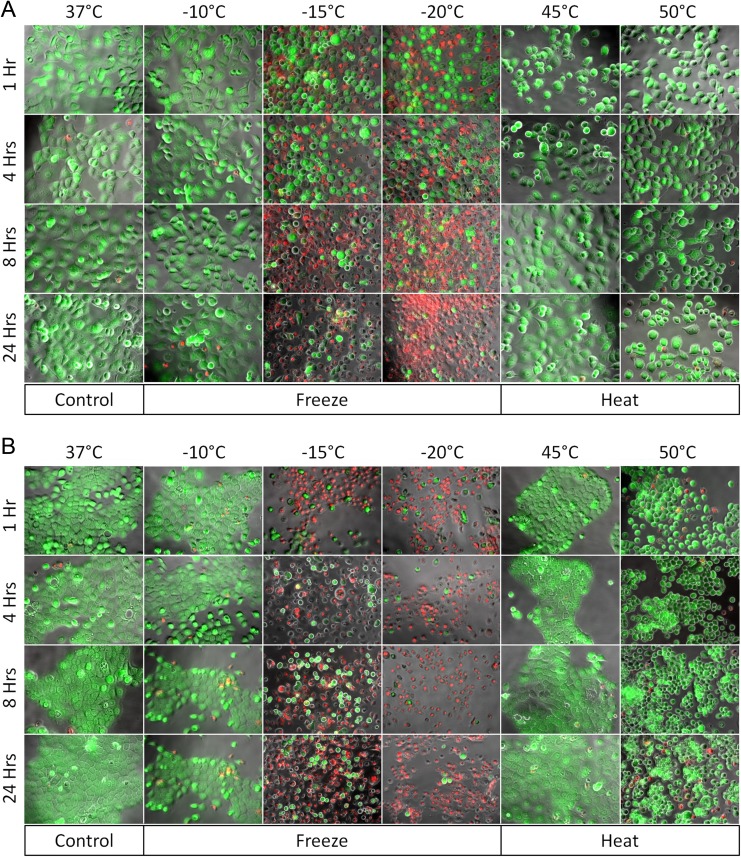
Figure 3.
Fluorescence micrographs of PaCa cells following thermal exposures. Following thermal exposures, PANC-1 (A) or BxPC-3 (B) cells were stained with propidium iodide (red) and Calcein-AM (green) at 1, 4, 8, and 24 hours and visualized under ×20 magnification. Green fluorescence indicates live, whereas red fluorescence indicates dead cells. Fluorescence images illustrate an increase in cell death at temperatures below −15°C and above 50°C at 24 hours posttreatment. These findings appear to correlate with postthaw viability results obtained from flow cytometry and alamarBlue analysis. AM indicates acetoxymethyl ester; PaCa, pancreatic cancer.

