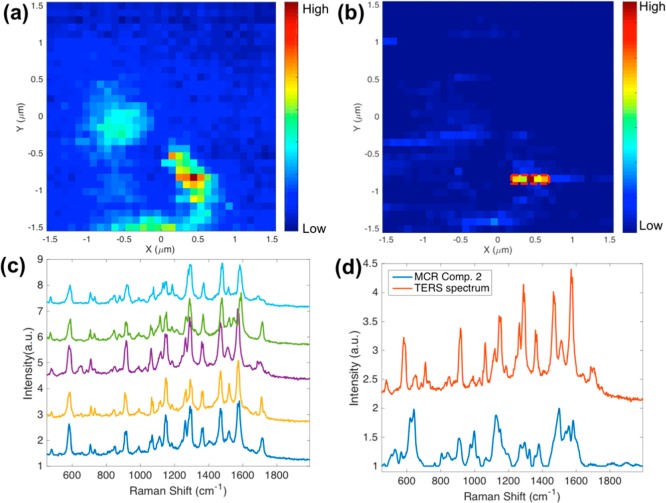
Figure 5.
TERS imaging of cyclic-RGDFC-GNRs bound with sw620 cells. (a) TERS heat map (3 × 3 μm2) generated using single-peak intensity at 1002 cm–1 (step size: 93 nm). (b) MCR map generated using scores of each TERS spectra toward the MCR component corresponding to integrin αvβ3 determined from the SERS experiments. (c) TERS spectra selected from high intensity pixels in panel b. (d) Comparison between TERS spectrum and MCR component. MCR is able to filter TERS data to generate much cleaner maps.

