
Figure 12.
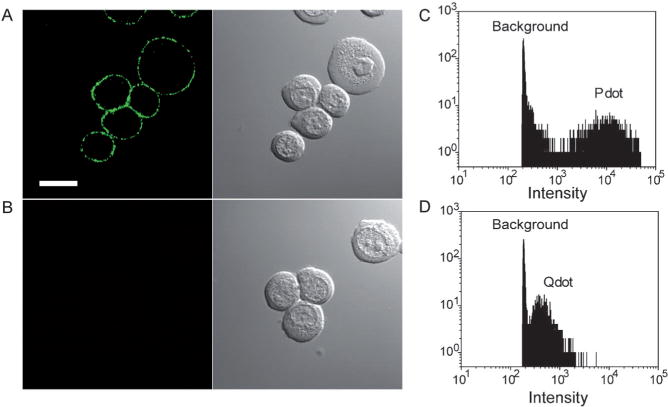
Specific cellular targeting with Pdot-bioconjugates. A) Fluorescence imaging of the cell-surface marker EpCAM on MCF-7 cells incubated sequentially with the anti-EpCAM primary antibody and Pdot-IgG conjugates. Scale bar: 10 μm. B) Fluorescence imaging of the control sample in which the cells were incubated with Pdot-IgG alone (no primary antibody). C) Fluorescence intensity distributions for Pdot-streptavidin-labeled MCF-7 cells. D) Fluorescence intensity distributions for Qdot 565-streptavidin-labeled MCF-7 cells obtained under identical experimental conditions as those used in C). Reproduced from Ref. [56] with permission.