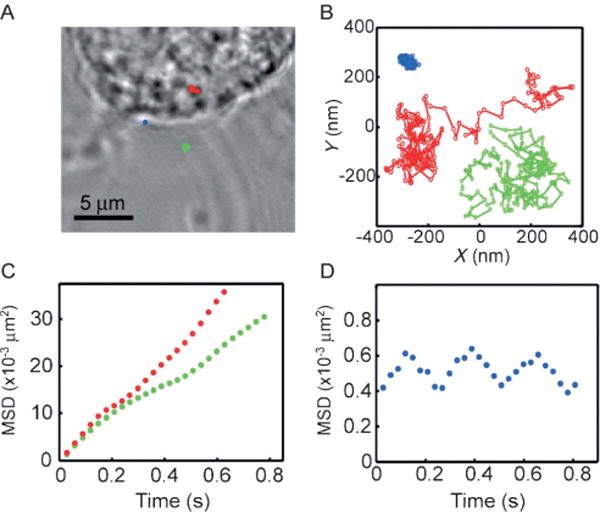
Figure 17.

Single-particle fluorescence tracking with highly fluorescent Pdots. A) Bright-field transmission image of a fixed cell. The color marks indicate the locations of the particles. Blue corresponds to a particle bound to the membrane, green corresponds to a particle outside the cell, and red corresponds to the cell interior. B) The trajectories for the three particles obtained from fluorescence tracking. C) Mean-square displacement (MSD) of the tracked PFBT Pdots inside a cell (red circles) and outside a cell (green circles), corresponding to diffusion constants of 3.3 × 10⁻³ μm2s−1 and 3.6 × 10⁻³ μm2s−1, respectively. D) Mean-square displacement of the Pdot adhered to the membrane. Reproduced from Ref. [53] with permission.
