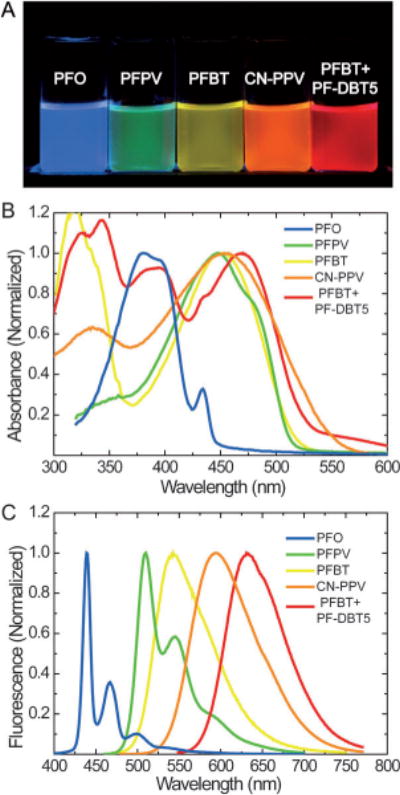
Figure 3.

Fluorescence spectra of Pdots. A) A photograph of aqueous Pdot suspensions under UV light illumination. Absorption (B) and emission (C) spectra. The spectra of PFO, PFPV, and PFBT Pdots were reproduced from Ref. [51] with permission. The spectra of CN-PPV Pdots were reproduced from Ref. [63] with permission. The spectra of polymer blend Pdots (PFBT+PF-DBT5) were reproduced from Ref. [58] with permission.
