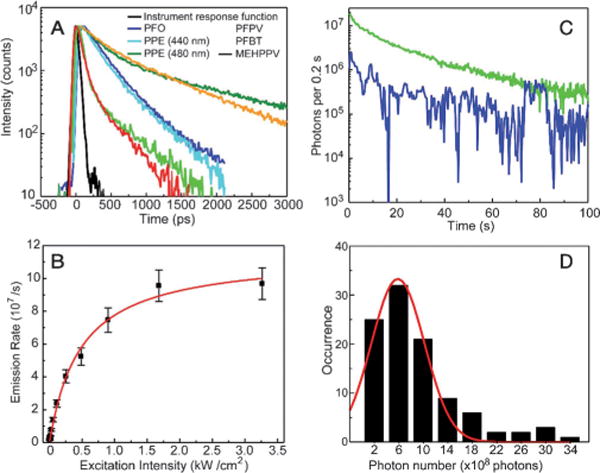
Figure 6.

A) Fluorescence lifetimes of Pdots measured by the TCSPC technique. B) Fluorescence saturation of single PFBT Pdots with increasing excitation intensity. C) Photobleaching trajectories of single PFBT Pdots. D) Histogram of the photon numbers of individual PFBT Pdots of about a 10 nm diameter. Reproduced from Ref. [51] with permission.
