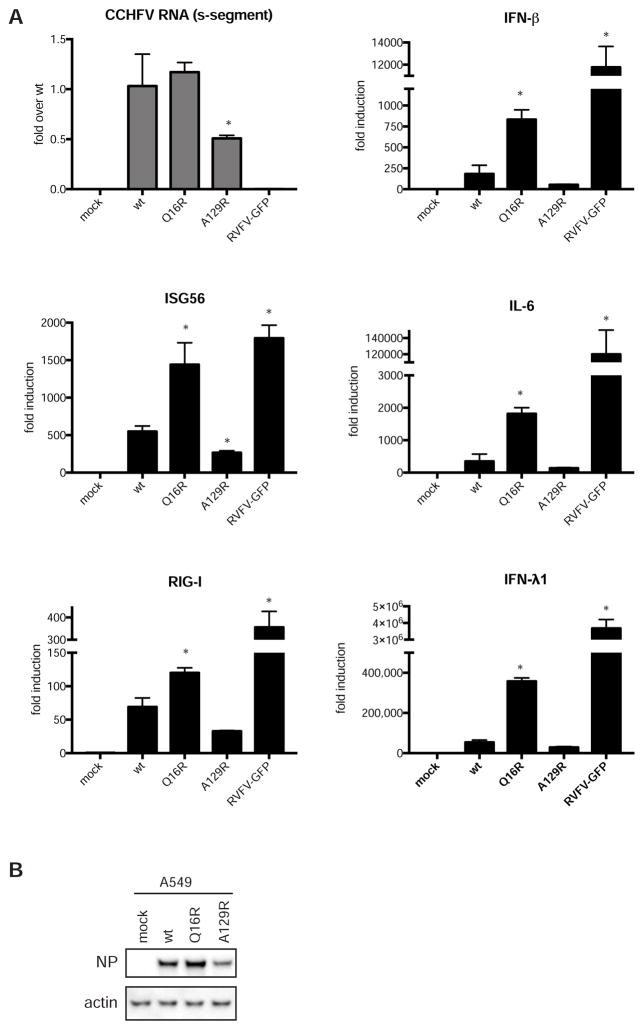
Figure 6. Immune responses in CCHFV-infected cells.
(A) A549 cells were infected with CCHFV or RVFV vaccine strain at an MOI of 3.3. RNA was isolated from samples harvested 24 h post infection, and transcripts of the indicated genes were quantified using RT-PCR. Data are mean ± SD of a representative experiment performed using 3 biological replicates, *p < 0.05. (B) CCHFV NP levels were determined by western blotting.

