Figure 1.

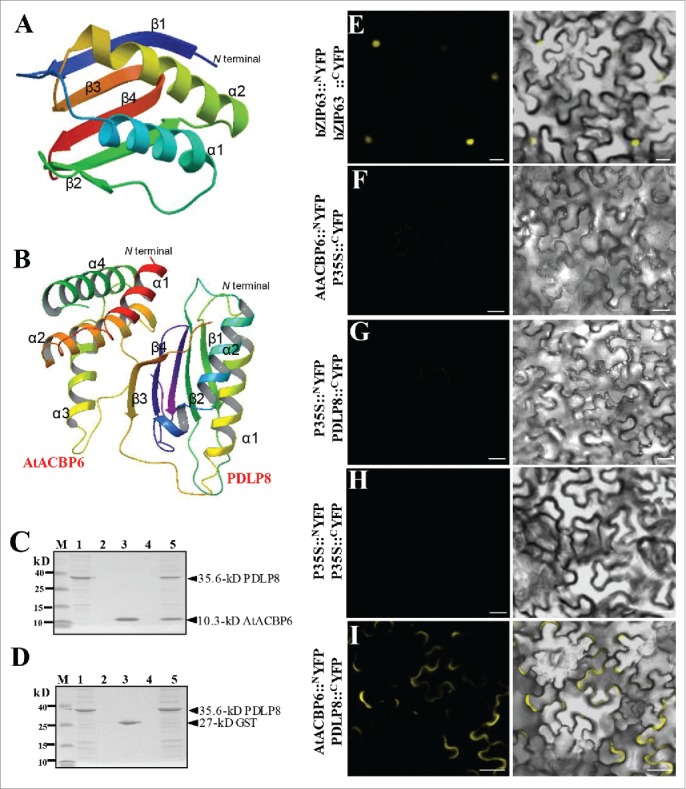
PDLP8 interacts with AtACBP6 at the plasma membrane. (A-B) The predicted 3-D structure of PDLP8 interacting with AtACBP6. An overall ribbon diagram showing the fold of PDLP8 (A), with α-helices colored yellow and light blue and β-sheets colored dark blue, green, orange and red. There are two helices and three β-sheets in this protein, with only one visible loop. The model were generated from 4XRE as template by using SWISS MODEL (www.swissmodel.expasy.org). The model consists of 2 α-helices and 4 β-sheets. The interaction between PDLP8 and AtACBP6 by docking via patchdock/firedock. Secondary structure is marked to show 4 α-helices in AtACBP6 as well as the 2 α-helices and 4 β-sheets in PDLP8 (B). The α1 and α2 helices of AtACBP6 are predicted to interact with the β3 and β4 sheets in PDLP8. Best model is represented with a binding affinity of -12.80 (ΔG). (C-D) The interaction between (His)6-PDLP8 and GST-tagged AtACBP6 (with the GST tag cleaved) was visualized by 15% SDS-PAGE. M, low-range rainbow marker; Lane 1, recombinant (His)6-PDLP8; Lane 2, flow-through after recombinant (His)6-PDLP8 is bound to the Ni-NTA magnetic agarose beads; Lane 3, recombinant GST-tagged AtACBP6 (with the GST tag cleaved); Lane 4, flow-through after incubation of recombinant (His)6-PDLP8 and recombinant AtACBP6 on the Ni-NTA magnetic agarose beads following washing to remove excess recombinant AtACBP6; Lane 5, elution from Ni-NTA magnetic agarose beads using buffer B. Arrows indicate the various recombinant proteins. (E-I) The interaction of PDLP8 and AtACBP6 was confirmed by bimolecular fluorescence complementation (BiFC). The interaction of BiFC assays using Agrobacterium-infiltrated tobacco leaves to examine the interaction between AtACBP6 with PDLP8 in vivo. (E) bZIP63-YFPN and bZIP63-YFPC, the positive controls, were expressed in the nucleus. (F-I) The combination of P35S::NYFP and 35S::cYFP, AtACBP6::NYFP and 35S::cYFP as well as P35S::NYFP and PDLP8::CYFP did not show any interaction, while AtACBP6::NYFP and PDLP8::CYFP showed signals of interaction in the plasma membrane (I). Bar = 20 µm.
