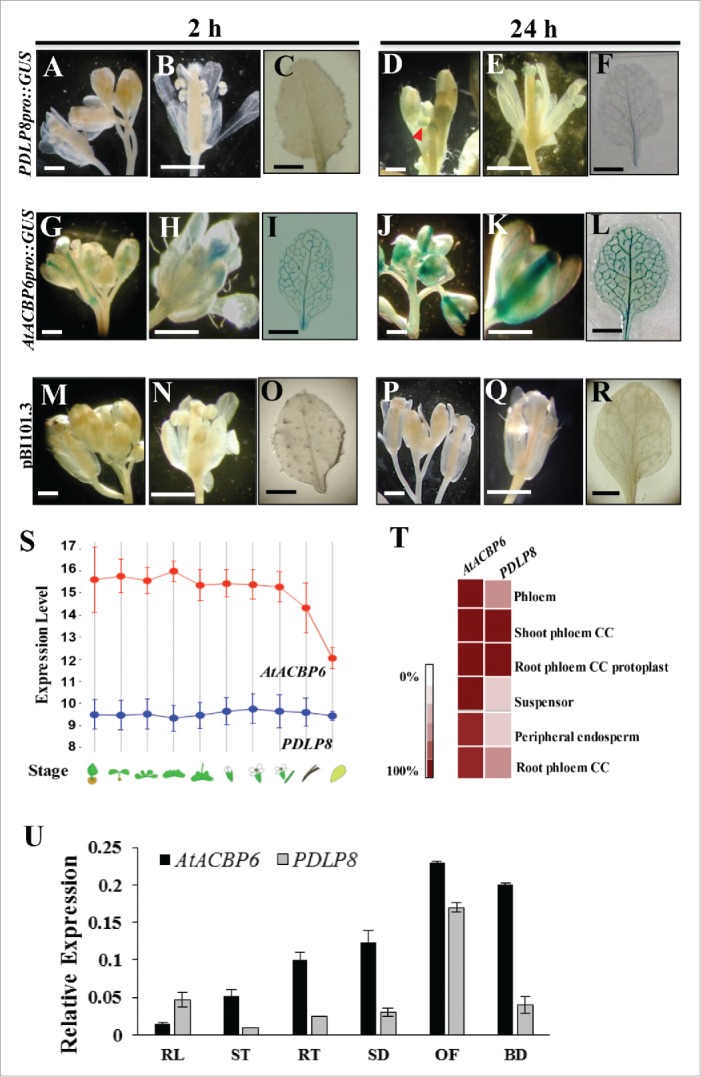
Figure 2.

Analysis in the expression pattern of AtACBP6 and PDLP8. Histochemical staining shows GUS expression of PDLP8pro::GUS (A-F) and AtACBP6pro::GUS (G-L), 8-week-old inflorescence, 10-DAF mature flowers and 3-week-old rosette leaves. Different GUS staining times are shown (2 h in A-C and G-I; 24 h in D-F and J-L). GUS expression was not detected in vector (pB101.3)-transformed control plants (M-R). (S-T) A comparison in expression of AtACBP6 and PDLP8 as carried out by analysis of microarray data from Genevestigator (https://genevestigator.com/gv/). (S) Expression of AtACBP6 and PDLP8 in different developmental stages. The red line indicates the expression of AtACBP6 and the blue represents the expression of PDLP8. (T) Heat map of the expression of AtACBP6 and PDLP8 in the phloem. CC, companion cells. (U) Quantitative real-time PCR analysis of PDLP8 and AtACBP6 expression in 4-week-old rosette leaves (RL), 4-week-old stems (ST), 4-week-old stems roots (RT), 1-week-old seedlings (SD), buds (BD) and 8-week-old open flowers (OF). Results were normalized against the expression of ACTIN2. Each bar represents a mean value of six repeats from two independent biological samples ± SD.
