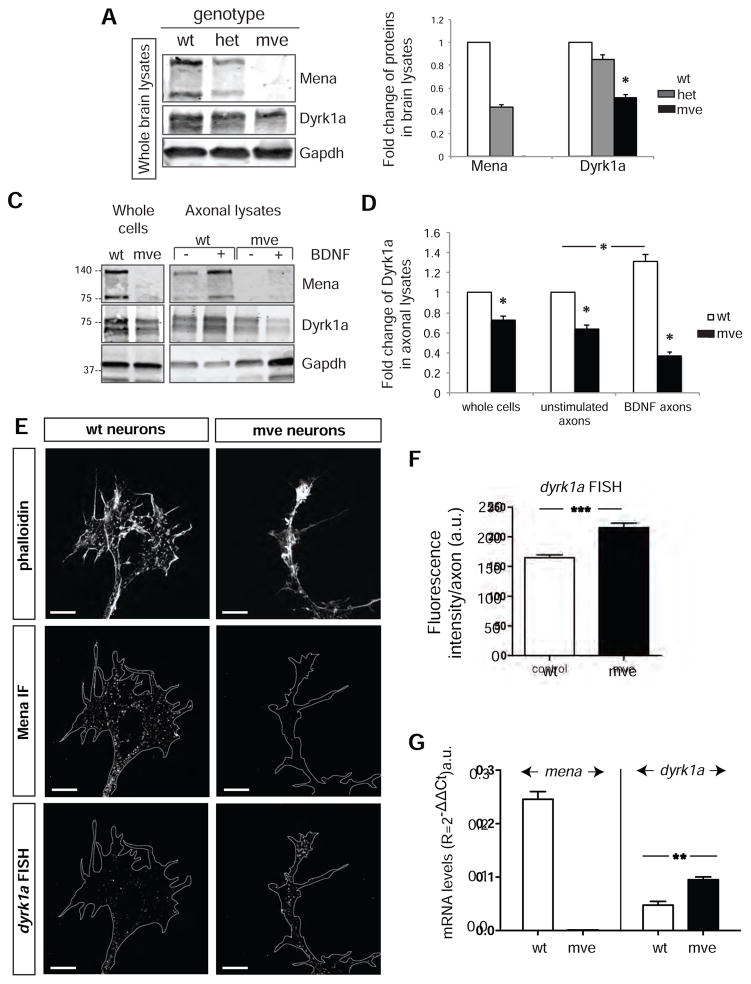
Figure 7. The absence of Mena does not affect localization of dyrk1a mRNA, but significantly reduces both steady-state and BDNF-elicted increases in Dyrk1a protein levels.
A. Western blots of whole brain lysates of different Mena genotypes (wt: Mena+/+;VASP−/−;EVL−/−, het: Mena+/−;VASP−/−;EVL−/−, mve: Mena−/_;VASP−/−;EVL−/−). B. Quantification of A. Protein levels are normalized to the wt protein amount. The graph represents Mean ± StDEV (Student’s T test p<0.05). C. Western blot analysis of lysates from axotomy assays showing Dyrk1a in mve vs wt axons before and after BDNF stimulation. D. Dyrk1a protein levels were significantly decreased in mve axons and were not changed by BDNF stimulation. Values were normalized to the wt protein levels using the GAPDH loading controls. The graph represents Mean ± StDEV (Two-Way Anova p*<0.05). E. FISH for dyrk1a mRNA on cultured cortical neurons (E15.5+2DIV) from wt and mve brains. Scale bar: 5μm. F. Quantification of the fluorescence intensity in axons and growth cones of wt and mve neurons. The graph represents Mean ± StDEV (Student’s T test p***<0.001). G. Quantitative RT-PCR analysis of mRNA from wt and mve neurons. The graph represents Mean ± StDEV (Student’s T test p**<0.01).

